I created a slidy report in markdown that using runtime shiny, in of the slides there are several plotly bar and pie charts. However, all the latter are going unligned (legend is half showing or sometimes overlapping with itself), see a snapshot:
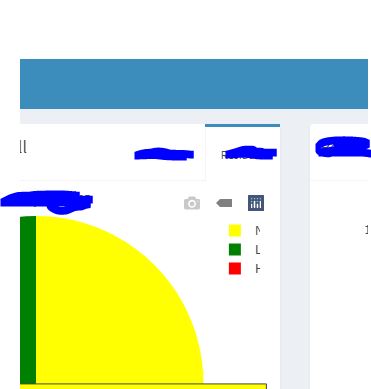
That's the only slide I'm facing this problem with, I tried setting the margin and y/x axis dimensions but nothing worked.
Any help please, my code below (plotly graphs parts):
shinyApp(

ui <- fluidPage(shinythemes::themeSelector(), useShinyjs(), useShinydashboard(),


                dashboardPage(
  dashboardHeader(title = "Plotly Graphs"),
dashboardSidebar(
    sidebarMenu(style = "position : fixed",
                selectInput(inputId = "year_1",
                                     label = h4("Select The Year"),
                                     choices = unique(data$Year),
                            width = '71.7%'),


                         pickerInput(inputId = "list_1",
                                     label = h4("Select Entity"),
                                     choices = c ("Department1", "Department2","Department3",
 "Department4", "Department5", "Department6", "Department7","Department8", "Department9",  "Department10",  "Department11",
                                     selected = data$Department,
                                     multiple = TRUE,
                                     options  = list(
                                       `actions-box` = TRUE,
                                       size = 10,
                                       width = '74.2%',
                                       `selected-text-format` = "count > 3",
                                       icon = icon("sync")
                                     )),

               checkboxGroupInput(inputId = "Rating1",
                                   label = h4("Filter1"),
                                   choices = c("one", "two", "three", "four"),
                                   selected = data$Rating1),

                         checkboxGroupInput(inputId = "Rating2",
                                            label = h4("Filter2"),
                                            choices = c("one", "two", "three", "four"),
                                            selected = data$Rating2,
                                            inline = TRUE,
                                            width = "75%")

                                     ))


))
  ,

dashboardBody(
  fluidRow(
    tabBox(side = "right", title = h4("Rating1 vs. Rating2 - Overall", align ='center'), id = "Rating2",
         tabPanel( h6("Rating1"),
                  plotlyOutput(outputId = "plotly_3"), verbatimTextOutput("Rating21Selected"), status = "primary", solidHeader = TRUE,
        collapsible = TRUE),

        tabPanel(h6("Rating2"),
                 plotlyOutput(outputId = "plotly_2"), status = "primary", solidHeader = TRUE,
        collapsible = TRUE, autoWidth = TRUE, scrollX = TRUE, scrollY = TRUE)),


  tabBox(side = "right", title = h4("Rating1 vs. Rating2 - Departments",  align ='center'), id = "Rating2 ",
         tabPanel(h6("Rating1"),
                 plotlyOutput(outputId = "plotly_7"), verbatimTextOutput("Rating2Selected"), status = "primary", solidHeader = TRUE,
        collapsible = TRUE, autoWidth = TRUE, scrollX = TRUE, scrollY = TRUE),

        tabPanel(h6("Rating1 "),
        plotlyOutput(outputId = "plotly_6"), status = "primary", solidHeader = TRUE,
        collapsible = TRUE, autoWidth = TRUE, scrollX = TRUE, scrollY = TRUE))
  )))),

server <- function(input, output, session) {

  ## Reactive Filter1
  Rating1_Filter <- reactive({
    data %>%
      filter(Year %in% input$year_1) %>%
      filter(Department %in% input$list_1) %>%
      filter(Rating1 %in% input$Rating1)

  })

  ## Reactive Filter2
   Rating2_Filter <- reactive({
    data %>%
      filter(Year %in% input$year_1) %>%
      filter(Department %in% input$list_1) %>%
      filter(Rating2 %in% input$Rating2)

  })


   ## Rating1 - Overall

  Pie_1 <- plot_ly(labels = ~Rating1, values = factor(1),
                   legendgroup = ~Rating1,
                   textinfo = 'label+value',
                   textposition = 'inside',
                   hoverinfo = 'text',
                   hoverlabel = list(font=list(size= '16')),
                   marker = list(colors = "red"),
                   showlegend = T)

  output$plotly_2 <- renderPlotly({
    Pie_1 %>%
      add_pie(data = Rating1_Filter()) %>%
      layout(title = "Rating1",
             xaxis = list(showgrid = FALSE, zeroline = FALSE, showticklabels = FALSE),
             yaxis = list(showgrid = FALSE, zeroline = FALSE, showticklabels = FALSE))
  })

  ## Rating1 - Across Department

  output$plotly_6 <- renderPlotly({
    Rating1_Filter() %>%
      count(Department, Rating1) %>%
      plot_ly(x = ~Department, y = ~n, color = ~Rating1, colors = c('one' = 'red', "two" = "yellow","three" = "green")) %>%
      layout(title = "Rating1",  hoverlabel = list(font=list(size= '16')),
             xaxis = list(showgrid = FALSE, zeroline = FALSE, showticklabels = TRUE, showlegend = FALSE),
             yaxis = list(showgrid = FALSE, zeroline = FALSE, showticklabels = TRUE, showlegend = FALSE, title = FALSE))

  })

  ## Rating2 - Overall

   ### Coding the colors:
  colors_list <- list(
    "one" = "red",
    "two" = "yellow",
    "three" = "green"
  )

  data$color <- dplyr::recode(data$Rating2, !!!colors_list)

  ## Rating2 - Overall (Pie Chart):
  Pie_2 <- plot_ly(labels = ~Rating2, values = factor(1),
                   legendgroup = ~Rating2,
                   textinfo = 'label+value',
                   textposition = 'inside',
                   hoverinfo = 'text',
                   marker = list(colors = ~color),
                   hoverlabel = list(font=list(size= '16')),
                   showlegend = T)


  output$plotly_3 <- renderPlotly({
    Pie_2 %>%
      add_pie(data = Rating2_Filter()) %>%
      layout(title = "Rating2",
             xaxis = list(showgrid = FALSE, zeroline = FALSE, showticklabels = FALSE),
             yaxis = list(showgrid = FALSE, zeroline = FALSE, showticklabels = FALSE))
  })

  ## Rating2 - Across Department

  output$plotly_7 <- renderPlotly({
    Rating2_Filter() %>%
      count(Department, Rating2) %>%
      plot_ly(x = ~Department, y = ~n, color = ~Rating2, colors = c('one' = 'red', 'two' = 'yellow', 'three' = 'darkgreen')) %>%
      layout(title = "Rating2", barmode = 'stack',  hoverlabel = list(font=list(size= '16')),
             legend = list(bgcolor = 'rgba(0,0,0,0)'),
             xaxis = list(tickangle = 40),
             yaxis = list(showgrid = FALSE, zeroline = FALSE, showticklabels = TRUE, showlegend = FALSE, title = FALSE))

  })
,

  options = list(height = 1000)
)
When I run the same shiny app separately it worked well but when I incorporated it into my slide presentation, the legends are out of alignment for all the plotly graphs, I do not know why this is happening, I will try to find another package to do my graph and incorporate them into my slidy, maybe it will work then.