Unable to order x axes in R

Hi
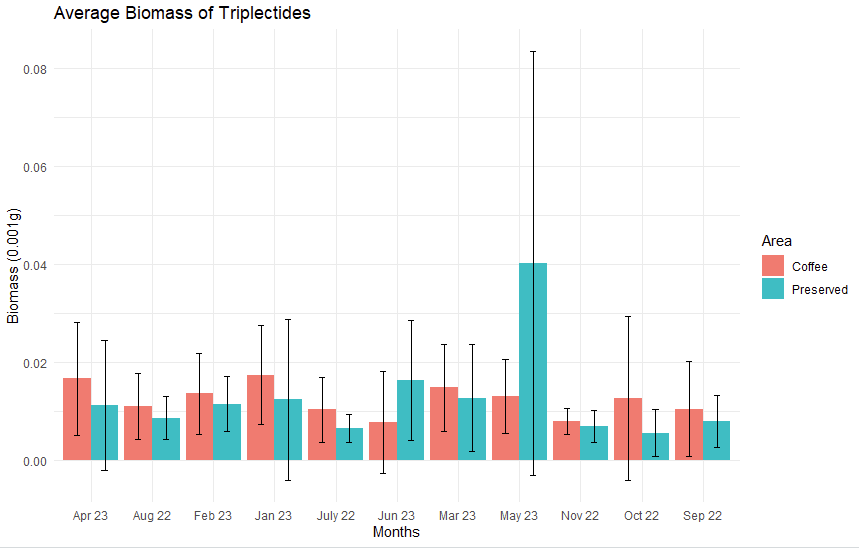
I'm trying to do a simple histogram with the biomass of a specific insect over the course of a year. Despite the order of the data in my spreadsheet, R is putting the x-axis in alphabetical order.
I've searched for some solutions here but no solution so far.

Code and Plot below:

library(ggplot2)
library(forcats)
library(dplyr)

#x axis change test 2

# data
df <- data.frame(
  Month = Triplectides_biomass$Month,
  Biomass = Triplectides_biomass$Biomass,
  Area = Triplectides_biomass$Area
  )

# Mean and standard error
df_summary <- df %>%
  group_by(Month, Area) %>%
  summarise(
    Mean_Biomass = mean(Biomass),
    SE_Biomass = sd(Biomass) / sqrt(n())
  )

# Plot
ggplot(df_summary, aes(x = Month, y = Mean_Biomass, fill = Area)) +
  geom_bar(stat = "identity", position = position_dodge()) +
  geom_errorbar(
    aes(ymin = Mean_Biomass - 1.96 * SE_Biomass,
        ymax = Mean_Biomass + 1.96 * SE_Biomass),
    width = 0.2,
    position = position_dodge(width = 0.9)  # Center the error bars
  ) +
  labs(x = "Months", y = "Biomass (0.001g)", title = "Average Biomass of Triplectides") +
  theme_minimal()

Any suggestions?

Hi @serpa.k , for get a better help try to put a reproducible example o the data, see this ways

I see that you don't put the Month column like a Date form? So, ggplot2 use this axis like a factor and not like a date.

With lubridate you could make this
cheatsheets>lubridate

Well, first of all, that's not a histogram. But never mind that. To reorder the Months by some other value, you can use reorder, as in

ggplot(df_summary, aes(x = reorder(Month, Mean_Biomass, decreasing = TRUE), y = Mean_Biomass, fill = Area))

Hi @M_AcostaCH , thanks for the answer

A exemple of my data:

Tripl_Bio <-tibble::tribble(
       ~Month..Area..Biomass,
     "July22 Coffee  0,0103",
       "Oct  Coffee  0,0125",
  "Feb23  Coffee  0,00,0136",
   "July22 Preserved 0,0055",
    "Oct22 Preserved 0,0563",
   "Feb23  Preserved 0,0114"
  )

head(Tripl_Bio)
#> # A tibble: 5 × 1
#>   Month..Area..Biomass    
#>   <chr>                   
#> 1 July22 Coffee  0,0103   
#> 2 Oct  Coffee  0,0125     
#> 3 Feb23  Coffee  0,00,0136
#> 4 July22 Preserved 0,0055 
#> 5 Oct22 Preserved 0,0563
#> 6 Feb23  Preserved 0,0114

Created on 2024-03-20 with reprex v2.1.0

About ludridate I trying figure out how to use properly without do changes manually.

Hi @mduvekot , thanks for the reply

Using this I can reorder but still not in a chronologic order. I need the axel go from July2022 to June2023

That tibble seems completely messed up. I think this data.frame is what was intended.

Tripl_Bio <- structure(list(Month = c("July 22", "Oct 01", "Feb 23", "July 22", 
"Oct 22", "Feb 23"), Area = c(" Coffee", " Coffee", " Coffee", 
" Preserved", " Preserved", " Preserved"), Biomas = c(0.0103, 
0.0125, 0.0136, 0.0055, 0.0563, 0.0114)), class = "data.frame", row.names = c(NA, 
-6L)) 

your dates are not data objects, they're text strings, so they can't be sorted chronologically. Convert them to dates, then use scale_x_date(). Something like this:

library(tidyverse)
tribble(
  ~Month, ~Year, ~Area, ~Biomass,
  "Jul", 2022, 'Coffee', 0.0103,
  "Oct", 2022,  "Coffee",  0.0125,
  "Feb", 2022,  "Coffee",  0.0136,
  "Jul", 2022, "Preserved", 0.0055,
  "Oct", 2022, "Preserved", 0.0563,
  "Feb", 2022,  "Preserved", 0.0114
) %>% 
  mutate(
    date = as.Date(paste0(Year, "-", Month, "-01"), format = "%Y-%b-%d")
    ) %>%
  ggplot(aes(x = date, y = Biomass, fill = Area)) +
  geom_col(position = position_dodge())+
  scale_x_date(date_labels = "%b\n%y", date_breaks = "1 month")

Hi Karoline,

I believe a small tweak to your df, similar @mduvekot's suggestion, from your original code should work. Here is the tweak along with the rest of your original code:

df <- data.frame(
  Month = Triplectides_biomass$Month,
  Biomass = Triplectides_biomass$Biomass,
  Area = Triplectides_biomass$Area
  ) |> 
  # add a 'date' column that expresses 'Month' as date
  # (the value "%b %y" captures your strings of the form "Apr 23")
  # (%b stands for "a[b]brevaition" and %y stands for two-digit [y]ear) 
  mutate(date = parse_date(Month, format = "%b %y")) |> 
  # use 'date' column to give "Month" column chronological order
  mutate(Month = fct_reorder(Month, date))
# Mean and standard error
df_summary <- df %>%
  group_by(Month, Area) %>%
  summarise(
    Mean_Biomass = mean(Biomass),
    SE_Biomass = sd(Biomass) / sqrt(n())
  )
# Plot
ggplot(df_summary, aes(x = Month, y = Mean_Biomass, fill = Area)) +
  geom_bar(stat = "identity", position = position_dodge()) +
  geom_errorbar(
    aes(ymin = Mean_Biomass - 1.96 * SE_Biomass,
        ymax = Mean_Biomass + 1.96 * SE_Biomass),
    width = 0.2,
    position = position_dodge(width = 0.9)  # Center the error bars
  ) +
  labs(x = "Months", y = "Biomass (0.001g)", title = "Average Biomass of Triplectides") +
  theme_minimal()