I have two tables, output through kable and kableextra, that have the same number of rows and columns, that are rendered differently in the output HTML document (which happens to be two shiny dashboard boxes). Any ideas how to get the same output (i.e., column widths, text formatting and text wrapping) in both tables?
The code:
OOLine <- c("Owner Occupied Housing",rep(" ",5))
RTLine <- c("Rental Housing",rep(" ",5))
m.HouseValO <- as.matrix(f.HouseVal[c(1,2),])
m.HouseValR <- as.matrix(f.HouseVal[c(3,4),])
m.HOwn <- rbind(OOLine,m.HouseValO)
m.HRent <- rbind(RTLine,m.HouseValR)
m.HouseVal <- rbind(OOLine,m.HouseValO,RTLine,m.HouseValR)
f.HouseVal <- as.data.frame(m.HouseVal)
names(f.HouseVal) <-c("Variable",paste0("Value: ",ctyname),paste0("Margin of Error: ", ctyname),
"Value: Colorado","Margin of Error: Colorado", "Signifcant Difference?")
# Setting up table
#Column Names
names_spaced <- c("Variable","Value","Margin of Error","Value","Margin of Error","Sig. Diff.?")
#Span Header
# create vector with colspan
tblHead1 <- c(" " = 1, ctyname = 2, "Colorado" = 2, " " = 1)
# set vector names
names(tblHead1) <- c(" ", ctyname, "Colorado", " ")
if(oType == "html") {
Housing_tab1 <- m.HOwn %>%
kable(format='html', table.attr='class="cleanTable"',
row.names=FALSE,
align='lrrrrrr',
caption="Comparative Owner-Occupied Housing Values",
col.names = names_spaced,
escape = FALSE) %>%
kable_styling(bootstrap_options = "condensed",full_width = F) %>%
row_spec(0, align = "c") %>%
column_spec(1, width = "3in") %>%
column_spec(2, width = "0.4in") %>%
column_spec(3, width ="0.4in") %>%
column_spec(4, width ="0.4in") %>%
column_spec(5, width ="0.4in") %>%
column_spec(6, width ="0.4in") %>%
add_header_above(header=tblHead1) %>%
add_footnote(captionSrc("ACS",ACS))
Housing_tab2 <- m.HRent%>%
kable(format='html', table.attr='class="cleanTable"',
row.names=FALSE,
align='lrrrrrr',
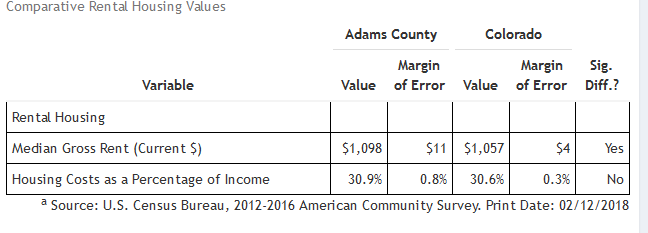
caption="Comparative Rental Housing Values",
col.names = names_spaced,
escape = FALSE) %>%
kable_styling(bootstrap_options = "condensed",full_width = F) %>%
row_spec(0, align = "c") %>%
column_spec(1, width = "3in") %>%
column_spec(2, width = "0.4in") %>%
column_spec(3, width ="0.4in") %>%
column_spec(4, width ="0.4in") %>%
column_spec(5, width ="0.4in") %>%
column_spec(6, width ="0.4in") %>%
add_header_above(header=tblHead1) %>%
add_footnote(captionSrc("ACS",ACS))
The output (in the Dashboard these tales are side by side):
Table 1 (Housing_tab1):
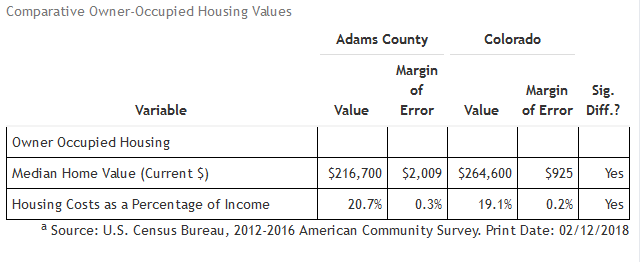
Table 2 (Housing_tab2)
)
TIA,
AB