Author: Greg Lin - GitHub - LinkedIn
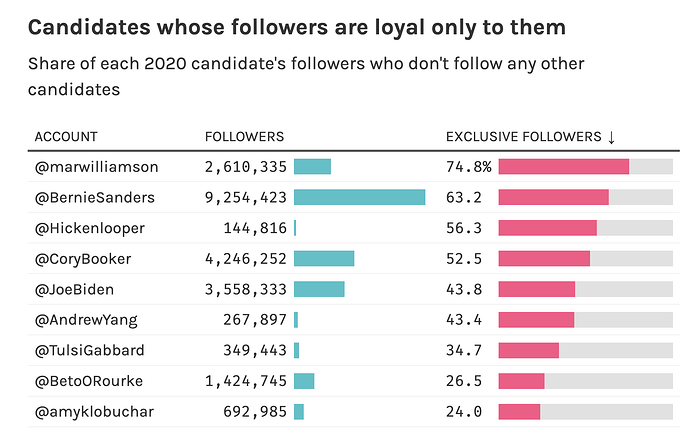
Table: Twitter Followers.
Repo: See the Twitter Followers vignette on the reactable package site.
Data: Source: FiveThirtyEight. Raw data: twitter_followers.csv .
The Twitter Followers demo is a re-creation of the table from the FiveThirtyEight article, Which 2020 Candidates Have The Most In Common … On Twitter?
It’s an interactive HTML table with sorting, data formatting, embedded bar charts, and custom styling. In this article, we’ll walk through how we made this table using reactable, and show a typical workflow for building tables.
This article on the reactable package website walks through in detail how the table is created. Including loading data and creating the basic table, adding horizontal bar charts, dynamic formatting, finishing touches for styling.
Code
library(reactable)
library(htmltools)
tbl <- reactable(
  data,
  pagination = FALSE,
  defaultSorted = "exclusive_followers_pct",
  defaultColDef = colDef(headerClass = "header", align = "left"),
  columns = list(
    account = colDef(
      cell = function(value) {
        url <- paste0("https://twitter.com/", value)
        tags$a(href = url, target = "_blank", paste0("@", value))
      },
      width = 150
    ),
    followers = colDef(
      defaultSortOrder = "desc",
      cell = function(value) {
        width <- paste0(value * 100 / max(data$followers), "%")
        value <- format(value, big.mark = ",")
        value <- format(value, width = 9, justify = "right")
        bar <- div(
          class = "bar-chart",
          style = list(marginRight = "6px"),
          div(class = "bar", style = list(width = width, backgroundColor = "#3fc1c9"))
        )
        div(class = "bar-cell", span(class = "number", value), bar)
      }
    ),
    exclusive_followers_pct = colDef(
      name = "Exclusive Followers",
      defaultSortOrder = "desc",
      cell = JS("function(cellInfo) {
        // Format as percentage
        const pct = (cellInfo.value * 100).toFixed(1) + '%'
        // Pad single-digit numbers
        let value = pct.padStart(5)
        // Show % on first row only
        if (cellInfo.viewIndex > 0) {
          value = value.replace('%', ' ')
        }
        // Render bar chart
        return (
          '<div class=\"bar-cell\">' +
            '<span class=\"number\">' + value + '</span>' +
            '<div class=\"bar-chart\" style=\"background-color: #e1e1e1\">' +
              '<div class=\"bar\" style=\"width: ' + pct + '; background-color: #fc5185\"></div>' +
            '</div>' +
          '</div>'
        )
      }"),
      html = TRUE
    )
  ),
  compact = TRUE,
  class = "followers-tbl"
)
# Add the title and subtitle
div(class = "twitter-followers",
    div(class = "followers-header",
        div(class = "followers-title", "Candidates whose followers are loyal only to them"),
        "Share of each 2020 candidate's followers who don't follow any other candidates"
    ),
    tbl
)
# Add Google Fonts to the page
tags$link(href = "https://fonts.googleapis.com/css?family=Karla:400,700|Fira+Mono&display=fallback",
          rel = "stylesheet")
/* CSS for the R Markdown document, inserted through a ```{css} code chunk */

/* Styles for the table container, title, and subtitle */
.twitter-followers {
  /* Center the table */
  margin: 0 auto;
  /* Reduce the table width */
  width: 575px;
  font-family: Karla, "Helvetica Neue", Helvetica, Arial, sans-serif;
}

.followers-header {
  margin: 8px 0;
  font-size: 16px;
}

.followers-title {
  font-size: 20px;
  font-weight: 600;
}

/* Styles for the table */
.followers-tbl {
  font-size: 14px;
  line-height: 18px;
}

.followers-tbl a {
  color: inherit;
}

/* Styles for the column headers */
.header {
  border-bottom: 2px solid #555;
  font-size: 13px;
  font-weight: 400;
  text-transform: uppercase;
}

.header:hover {
  background-color: #eee;
}

/* Styles for the bar charts */
.bar-cell {
  display: flex;
  align-items: center;
}

.number {
  font-family: "Fira Mono", Consolas, Monaco, monospace;
  font-size: 13.5px;
  white-space: pre;
}

.bar-chart {
  flex-grow: 1;
  margin-left: 6px;
  height: 14px;
}

.bar {
  height: 100%;
}
