trying to use 2-way anova and failing

Hi,

I am a complete novice when it comes to r-studio.
I have to complete statistical analysis for a report at uni and I chose to use 2-way anova. Now that I am trying to completed it I cant work out if my data is incompatible or if the way Ive produced my data on excel is wrong. This is not something I have a lecturer for so I'm really stuck.
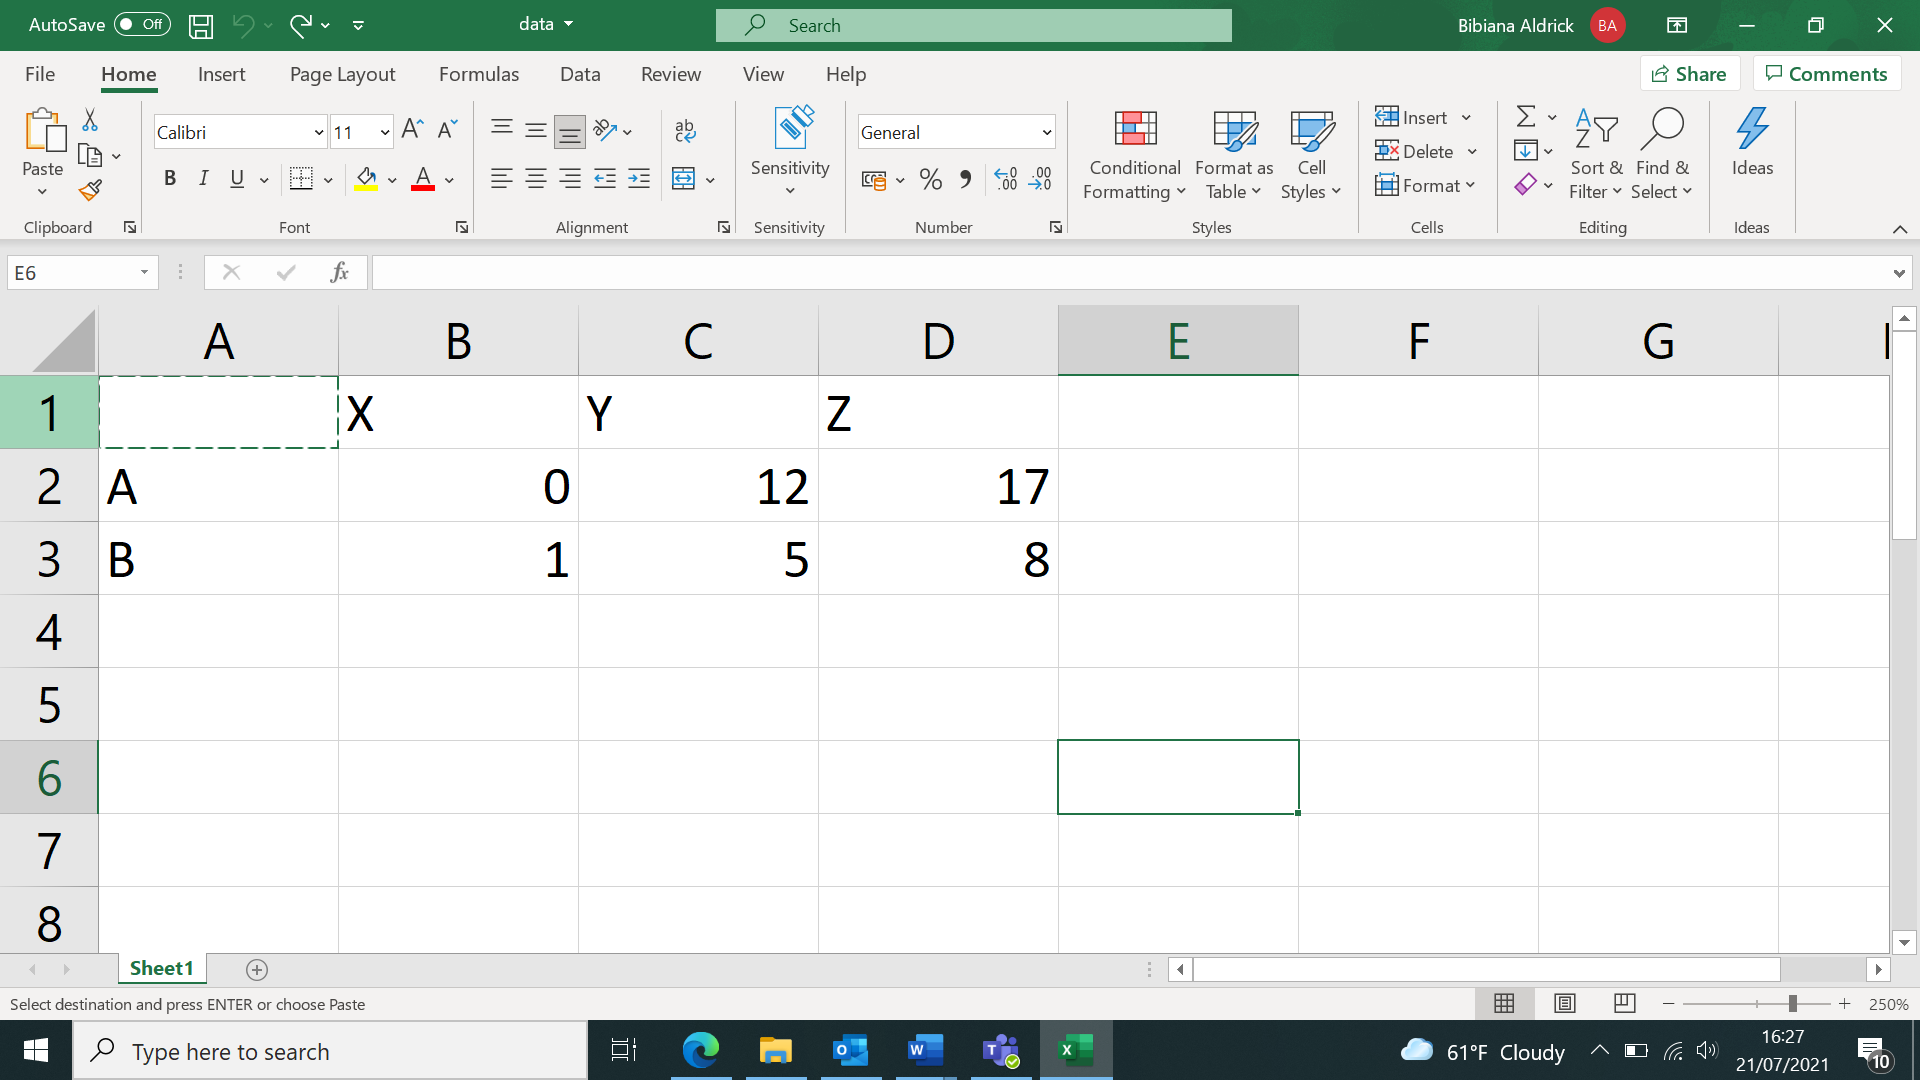
This is what my data set looks like

glimpse(data)
Rows: 2
Columns: 4
...1 "A", "B"
X 0, 1
Y 12, 5
Z 17, 8
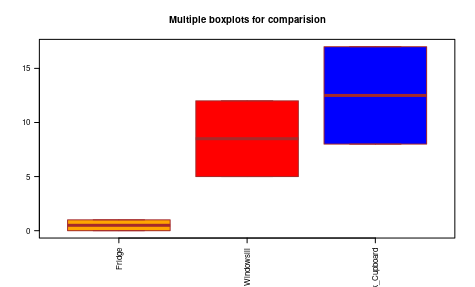
Ive also managed to create a box plot but the data is between 2 different fruits in 3 different locations and the box plot makes it look like one fruit I dont know how to add into rstudio there is two different fruit.

boxplot(X, Y, Z,
main = "Multiple boxplots for comparision",
at = c(1,2,3),
names = c("Fridge", "Windowsill", "Dark_Cupboard"),
las = 2,
cex.lab=0.5,
col = c("orange","red","blue"),
border = "brown",
horizontal = FALSE,
notch = FALSE
)

image

I really hope this makes sence and thanks in advance to anyone who tried to help

Hi bibi24

Welcome to the forum

What we really need to help is a good example of your data. A handy way to supply sample data is to use the dput() function. See ?dput. If you have a very large data set then something like head(dput(myfile), 100) will likely supply enough data for us to work with. As a quick example using the built-in data set iris

> dput(head(iris, 10))
structure(list(Sepal.Length = c(5.1, 4.9, 4.7, 4.6, 5, 5.4, 4.6, 
5, 4.4, 4.9), Sepal.Width = c(3.5, 3, 3.2, 3.1, 3.6, 3.9, 3.4, 
3.4, 2.9, 3.1), Petal.Length = c(1.4, 1.4, 1.3, 1.5, 1.4, 1.7, 
1.4, 1.5, 1.4, 1.5), Petal.Width = c(0.2, 0.2, 0.2, 0.2, 0.2, 
0.4, 0.3, 0.2, 0.2, 0.1), Species = structure(c(1L, 1L, 1L, 1L, 
1L, 1L, 1L, 1L, 1L, 1L), .Label = c("setosa", "versicolor", "virginica"
), class = "factor")), row.names = c(NA, 10L), class = "data.frame")

Overall a reproducible example (reprex)

is likely to be most helpful.

Hi,

Thankyou so much for your reply,

I ran the dput() and the output is shown below, I hope this helps abit.

dput(data)
structure(list(...1 = c("A", "B"), X = c(0, 1), Y = c(12, 5),
Z = c(17, 8)), row.names = c(NA, -2L), class = c("tbl_df",
"tbl", "data.frame"))

I just realized that you should have an id name in that spreadsheet. A variable name such as ...1 probably will work but it looks a bit weird.

Next we need to know what is the dependent variable and which two are the independent variables which you want to use, for I think we need to turn them into factors .

Have a look at this tutorial to see what I mean.

A reprex would help. See above

This topic was automatically closed 21 days after the last reply. New replies are no longer allowed.

If you have a query related to it or one of the replies, start a new topic and refer back with a link.