i keep trying to run control c to copy to the clipboard, but not sure why it is not working
reprex()
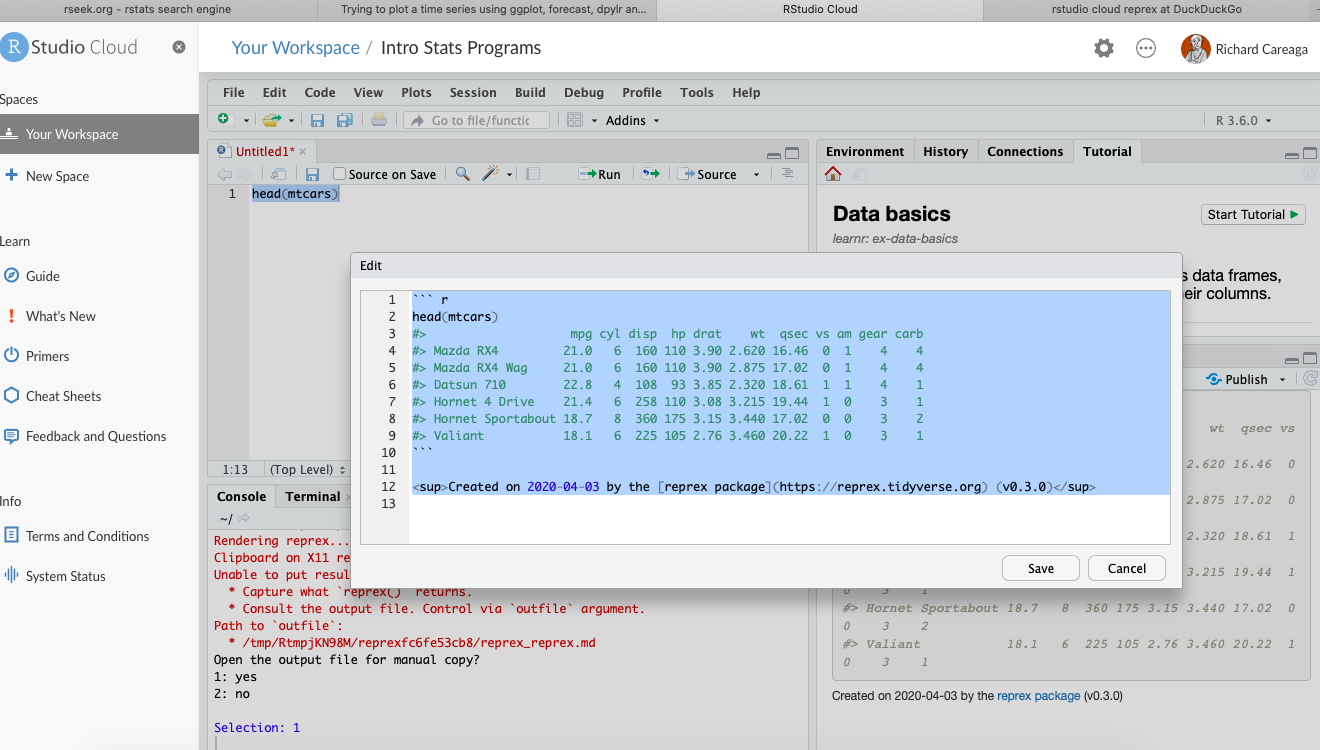
No input provided and clipboard is not available.
Rendering reprex...
Clipboard on X11 requires 'xclip' (recommended) or 'xsel'.
Unable to put result on the clipboard. How to get it:
Capture what reprex() returns.
Consult the output file. Control via outfile argument.
Path to outfile:
/tmp/RtmpCrmSFV/reprexfd21c79e5c/reprex_reprex.md
Open the output file for manual copy?
1: yes
2: no
I just hate it when this happens to be. Running the reprex will put it on the clipboard. In the unices, at least either CTRL *V or SHIFT CTRL V to put it into dialog box.
Update: D'oh on me. Even with V, there's nothing going in. Do you have RStudio to do this with? It's been quite some time that I've worked with X11
Sorry I blew by the cloud environment. There's an extra step. You select the copy option in the dialog box after running reprex selection or file from the addins menu (use the search box to find it). Hope the screen show shows the way