IM trying to make a histogram wherein weight is in the horizontal axis
I cant do histogram.
I cant use command
variable=data$Weight.Count
and hist (variable, frequency=F)
Ive tried changing weight to number, no success
class(count)
[1] "character"
count=as.numeric(gsub(",","",count))
class(count)
[1] "numeric"
variable=weight.count
Error: object 'weight.count' not found
variable=data$weight.count
variable=data$weight.count
hist(variable)
Error in hist.default(variable) : 'x' must be numeric
class(weight)
[1] "character"
weight=as.numeric(gsub(",","",weight))
Warning message:
NAs introduced by coercion
class(weight)
[1] "numeric"
variable=weight.count
Error: object 'weight.count' not found
variable=data$weight.count
variable=data$weight.count
hist(variable)
Error in hist.default(variable) : 'x' must be numeric
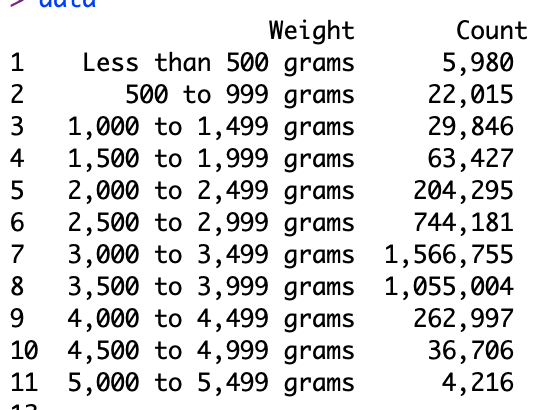
That doesn't exist. You have two columns, weight and count.
You can't really make a histogram with the dataset that you have shown, unless this is just a summary of the dataset. You might want to make a bar plot instead.
A histogram is a bar chart. When your dataset has observations allocated to buckets suitable for an x axis and frequency counts for a yaxis, if you directly bar plot that the result is a histogram. Your count field is character , its a set of digit symbols with commas. The easiest way to convert such a field is with library readr which has a parse_number function.