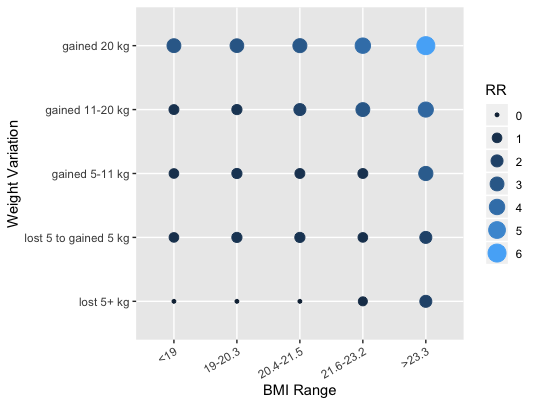
A scatterplot are just points placed on a plane based on (x, y) coordinates provided, and doesn't map any value to those points, you are not maping any variable to the x and y axes and if I correctly understand your problem, even if you reshape your data into a long format those axis would be categorical (scatterplots need numerical scales), this is the closest I can get to a scatterplot using your data and including the BMI values.
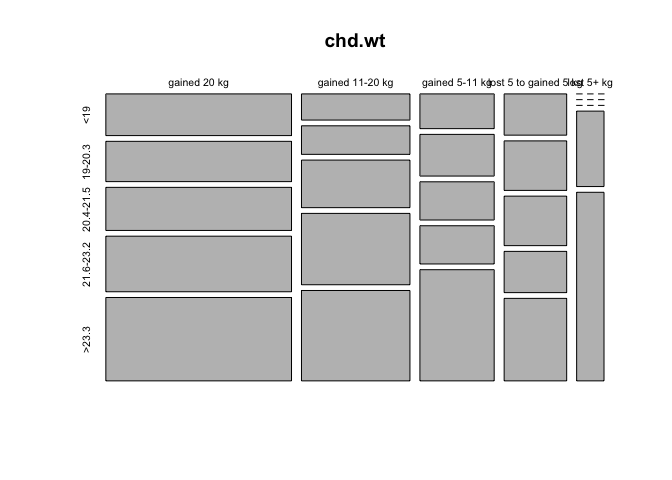
chd.wt<-matrix(c(3, 2.9, 3.1, 4, 6, 1.1, 1.2, 2, 3, 3.8, 1, 1.2, 1.1, 1.1, 3.2, 1, 1.2, 1.2, 1, 2, 0, 0, 0, 0.8, 2), byrow = T, ncol = 5)
colnames(chd.wt)<-c("<19", "19-20.3", "20.4-21.5", "21.6-23.2", ">23.3")
rownames(chd.wt)<-c("gained 20 kg", "gained 11-20 kg", "gained 5-11 kg", "lost 5 to gained 5 kg", "lost 5+ kg")

library(tidyverse)
as_tibble(chd.wt) %>%
    bind_cols("weight" = rownames(chd.wt)) %>%
    gather(age, BMI, -weight) %>%
    mutate(age = factor(age, levels = c("<19", "19-20.3", "20.4-21.5", "21.6-23.2", ">23.3")),
           weight = factor(weight, levels = c("gained 20 kg", "gained 11-20 kg", "gained 5-11 kg", "lost 5 to gained 5 kg", "lost 5+ kg"))
           ) %>%
    ggplot(aes(x = age, y = fct_rev(weight))) +
    geom_point(aes(color = BMI, size = BMI)) +
    scale_color_continuous(guide = "legend") +
    labs(x = "Age Range",
         y = "Weight Variation",
         color = "BMI",
         size = "BMI") +
    theme(axis.text.x = element_text(angle=30, hjust=1, vjust = 1))
Created on 2019-07-04 by the reprex package (v0.3.0)
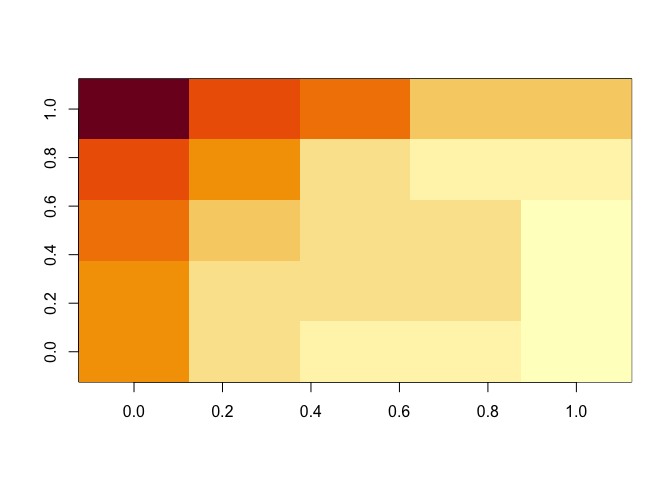
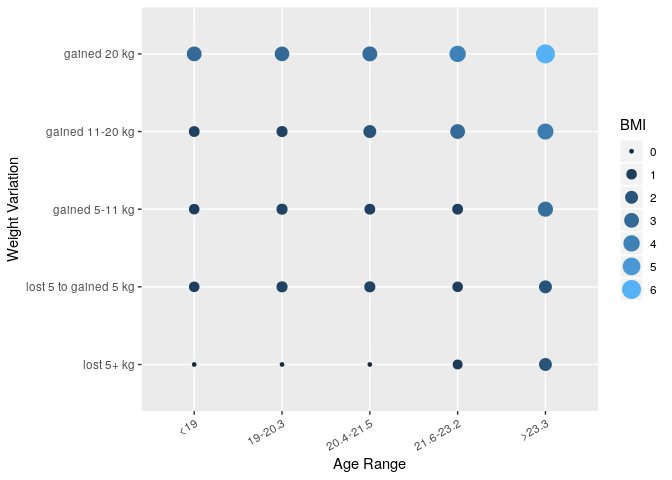
EDIT: I think geom_tile() looks better in this case
as_tibble(chd.wt) %>%
    bind_cols("weight" = rownames(chd.wt)) %>%
    gather(age, BMI, -weight) %>%
    mutate(age = factor(age, levels = c("<19", "19-20.3", "20.4-21.5", "21.6-23.2", ">23.3")),
           weight = factor(weight, levels = c("gained 20 kg", "gained 11-20 kg", "gained 5-11 kg", "lost 5 to gained 5 kg", "lost 5+ kg"))
    ) %>%
    ggplot(aes(x = age, y = fct_rev(weight))) +
    geom_tile(aes(fill = BMI)) +
    labs(x = "Age Range",
         y = "Weight Variation",
         fill = "BMI") +
    theme(axis.text.x = element_text(angle=30, hjust=1, vjust = 1))