There's probably an easy answer here I'm just missing, but I'm not finding it. Here's the scenario.
The specific goal I have is this: take a 1D table of frequencies [created with table()] that has many categories, and create a version that condenses the smaller categories into a combined "Other" category. So, for example, take the table
 A  B  C  D
10  6  2  1
and convert it to
 A  B  Other
10  6      3
by summing the entries C & D into the Other category.
More generally, as you'll see in the code sample, I'm trying to either concatenate two existing 1D tables together, or add a value/entry to an existing 1D table through a statement akin to addtablevalue("Other" = 3). Ideally I'd find a way to use both approaches.
My code sample below includes what I thought would work but didn't, and an approach that get the job done but feel a little kludgy. Hoping there's a way that avoids a having to convert among types.
(Apologies if this is a bit long, because I took it straight from the notes I was keeping.)
# Create the full table of four entries and then a truncated version with
# the first two entries (categories A & B)
tmain <- table(c(rep("A", 10), rep("B", 6), "C", "C", "D"))
ttrunc <- tmain[1:2]

# Attempts to create the new table

# Approach 1 (A failure): Add a value to the truncated table by creating a
# new entry index, then add the name for that value
tnew <- ttrunc  # Copy our short table
tnew[3] <- sum(tmain[3:4])   # Add a new value to the end of the table
names(tnew)[3] <- "Other"   # Provide a name for that
# This initially appears to work - it's class is "table" and the right
# values are present, but str() shows a difference in structure details
# This has functional implications as barplot() fails
tnew   # Looks okay...
class(tnew)  # It is a table...
# But compare the structure now to the original structure of ttrunc
str(ttrunc)   # Gives 'table' int [1:2(1d)] 10 6 ...
str(tnew)   # Gives 'table' Named int [1:3] 10 6 3 ...
# Does applying as.table() fix it? No
tnew <- as.table(tnew)
str(tnew)  # Still the same non-standard table format
# A particular issue is that the altered format no longer works correctly in plots
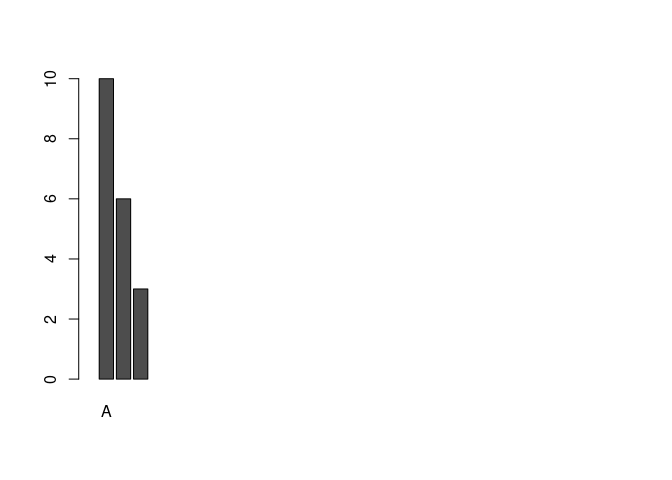
barplot(ttrunc)  # The original table works
barplot(tnew)  # New one fails: 'height' must be a vector or a matrix

# Approach 2 (My work-around): Create a one-value table for Other then
# append it to ttrunc
# Create a new, one entry table of Other in the correct format
tother <- as.table(c("Other" = sum(tmain[3:4])))
str(tother)  # Format is a standard table

# How to append this to the table ttrunc?
# Not cbind() - It rotates ttrunc and then adds a column with two rows of
# the single value in tnew
cbind(ttrunc, tother)

# c() successfully combines the tables, but converts them into a vector
tnew <- c(ttrunc, tother)
str(tnew)
# (Using append() gives the same result)
# This does work with barplot()
barplot(tnew)
# And with prop.table(), although the output is still a vector
tprop <- prop.table(tnew)
str(tprop)

# To get true table format, this works, but feels like a kludge
# Can't we avoid having a vector in the first place?
tnew <- as.table(tnew)
So as the notes suggest, it just seems there should be a way to do this that involves less steps and keeps the data in the normal table format throughout.
Thanks for any help!
