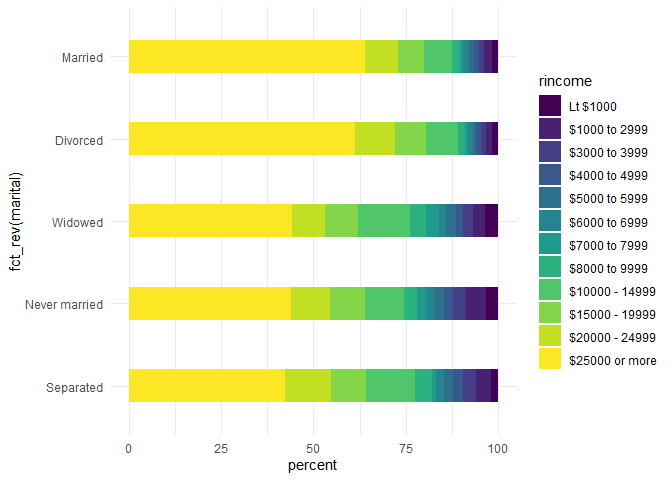
Hi. I'm attempting to sort marital groups in descending order of income using a stacked barchart. I have a solution, but am having trouble wrapping it into a function. When I attempt to do so, I end up with NAs in the marital column. My goal is to get the same plot output as shown below, but using a function to wrap this chunk of code (to make it more general). Thanks.
data_sorted <- group_income %>%
filter(rincome == "$25000 or more") %>%
arrange(desc(percent))

group_income <- group_income %>%
mutate(marital = factor(marital, levels=data_sorted %>% pull(marital)))
Below is the full example:
suppressWarnings({
library(tidyverse)
library(viridis)})
#> Loading required package: viridisLite

# reverse code income
gss_cat2 <- gss_cat %>% # gss_cat loads with tidyverse
  mutate(rincome = fct_rev(rincome))

# filter non-income responses
"%!in%" <- Negate("%in%")

group_income <- gss_cat2 %>%
  filter(rincome %!in% c("No answer", "Don't know", "Refused", "Not applicable")) %>%
  group_by(marital, rincome) %>%
  summarize(n = n()) %>%
  mutate(percent = round((n / sum(n)*100), 2))
#> `summarise()` has grouped output by 'marital'. You can override using the `.groups` argument.

# sort marital by income
# using one of the responses here: https://forum.posit.co/t/r-ggplot2-reorder-stacked-plot/23912/5
data_sorted <- group_income %>%
  filter(rincome == "$25000 or more") %>%
  arrange(desc(percent))

# recode marital based on income sorting
group_income <- group_income %>%
  mutate(marital = factor(marital, levels=data_sorted %>% pull(marital)))

# the point of this is to plot in descending order using a stacked bar chart
group_income %>%
  filter(!is.na(marital)) %>%
  ggplot(aes(x = percent, y = fct_rev(marital), fill = rincome)) +
  geom_col(width = 0.4) +
  scale_fill_viridis(discrete = TRUE) +
  theme_minimal()
# what I'd like to do is wrap the "sort marital by income," and "recode marital"
# chunks into a function, ideally so that the whole thing can be piped together
sort_descending <- function(df, filter_var, filter_lab, sort_var) {

  df_sorted <- df %>%
    filter({{filter_var}} == filter_lab) %>%
    arrange(desc(percent))

  df <- df %>%
    mutate(!!sort_var := factor(!!sort_var, levels=df_sorted %>% pull({{sort_var}})))

  df
}

# so far, when I do so, I get NAs in the marital column
sort_descending(group_income, rincome, "$25000 or more", "marital")
#> # A tibble: 62 x 4
#> # Groups:   marital [1]
#>    marital rincome            n percent
#>    <fct>   <fct>          <int>   <dbl>
#>  1 <NA>    $10000 - 14999     1   50
#>  2 <NA>    $20000 - 24999     1   50
#>  3 <NA>    Lt $1000         124    3.39
#>  4 <NA>    $1000 to 2999    196    5.35
#>  5 <NA>    $3000 to 3999    125    3.41
#>  6 <NA>    $4000 to 4999     95    2.59
#>  7 <NA>    $5000 to 5999     92    2.51
#>  8 <NA>    $6000 to 6999     82    2.24
#>  9 <NA>    $7000 to 7999     85    2.32
#> 10 <NA>    $8000 to 9999    135    3.69
#> # ... with 52 more rows
Created on 2021-08-18 by the reprex package (v2.0.0)