Ina
1
| Famíly |
Moon |
Resíduo |
| Epinephelidae |
crescente |
52.893 |
| Epinephelidae |
cheia |
47.021 |
| Epinephelidae |
minguante |
0.043 |
| Epinephelidae |
nova |
0.043 |
| Lutjanidae |
crescente |
-1.248 |
| Lutjanidae |
cheia |
2.635 |
| Lutjanidae |
minguante |
-0.139 |
| Lutjanidae |
nova |
-1.248 |
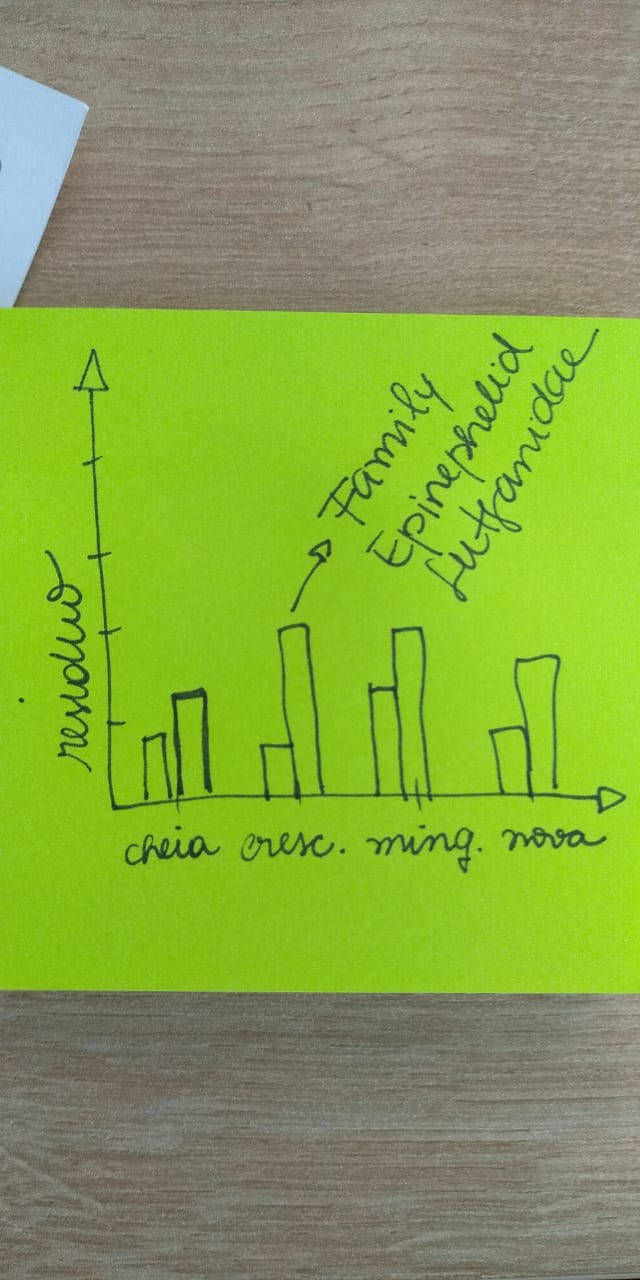
I want to plot like this:
cderv
2
hi,
what did you try so far ?
1 Like
Ina
3
resfam<-read.csv("residuo-barplot.csv", sep = ";")
resfam
resfami<-ggplot(resfam, aes(x = Lua, y = Resíduo, fill = Família)) + geom_bar(position="identity", stat = "identity", width = 0.5) + theme_classic()
resfami
but i would like 2 bars representing the families in the x axis instead of using "fill" to separate them.
cderv
4
You are looking for the group aesthetic and you need to use position dodge to put bar next to another.
Look at documentation for example of position_dodge()
one possible answer if you don't want to try yourself
tab <- tibble::tribble(
          ~Family,       ~Moon, ~Residuo,
  "Epinephelidae", "crescente",   52.893,
  "Epinephelidae",     "cheia",   47.021,
  "Epinephelidae", "minguante",    0.043,
  "Epinephelidae",      "nova",    0.043,
     "Lutjanidae", "crescente",   -1.248,
     "Lutjanidae",     "cheia",    2.635,
     "Lutjanidae", "minguante",   -0.139,
     "Lutjanidae",      "nova",   -1.248
  )

library(ggplot2)
ggplot(tab, aes(x = Moon, y = Residuo)) +
  geom_col(aes(group = Family), position = "dodge", fill = "lightblue") +
  theme_classic()
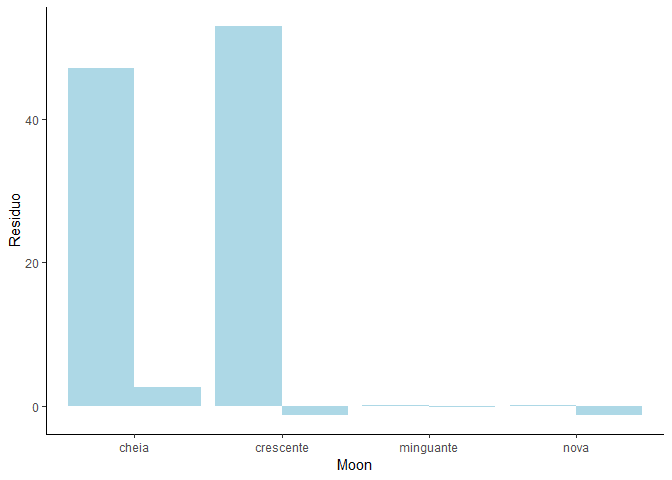
Created on 2019-01-25 by the reprex package (v0.2.1)
2 Likes
system
Closed
5
This topic was automatically closed 7 days after the last reply. New replies are no longer allowed.
If you have a query related to it or one of the replies, start a new topic and refer back with a link.