I'm not sure if this is what you are trying to do, but I think you can use this example as a starting point
library(tidyverse, quietly = TRUE)
binary_data <- data.frame(stringsAsFactors=FALSE,
Species = c("Lutajnus synagris", "Lutjanus analis", "Lutjanus apodus",
"Lutjanus cyanopterus", "Lutjanus griseus", "Lutjanus jocu",
"Ocyurus chysurus"),
spring = c(1, 1, 1, 1, 1, 1, 0),
summer = c(1, 1, 0, 1, 0, 1, 1),
fall = c(0, 0, 0, 0, 0, 1, 0),
winter = c(0, 0, 0, 0, 0, 1, 0)
)
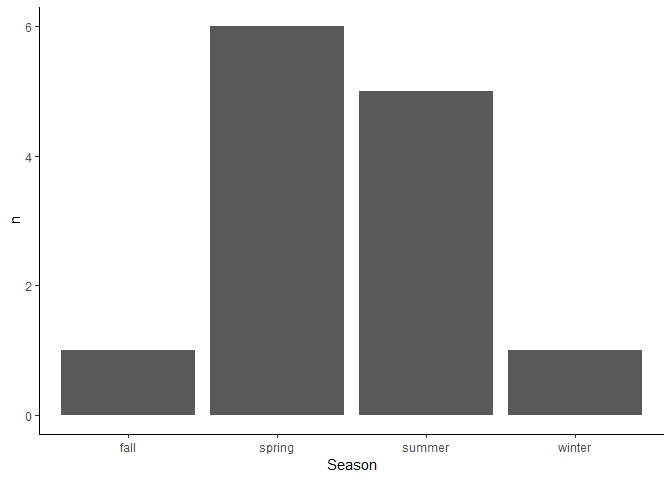
binary_data %>%
gather('Season', 'Presence', -Species) %>%
group_by(Season) %>%
summarise(n = sum(Presence)) %>%
ggplot(aes(x = Season, y = n)) +
geom_col() +
theme_classic()
Created on 2019-01-11 by the reprex package (v0.2.1)