I have these binary data:
| spring | summer | fall | winter | |
|---|---|---|---|---|
| Lutajnus synagris | 1 | 1 | 0 | 0 |
| Lutjanus analis | 1 | 1 | 0 | 0 |
| Lutjanus apodus | 1 | 0 | 0 | 0 |
| Lutjanus cyanopterus | 1 | 1 | 0 | 0 |
| Lutjanus griseus | 1 | 0 | 0 | 0 |
| Lutjanus jocu | 1 | 1 | 1 | 1 |
| Ocyurus chysurus | 0 | 1 | 0 | 0 |
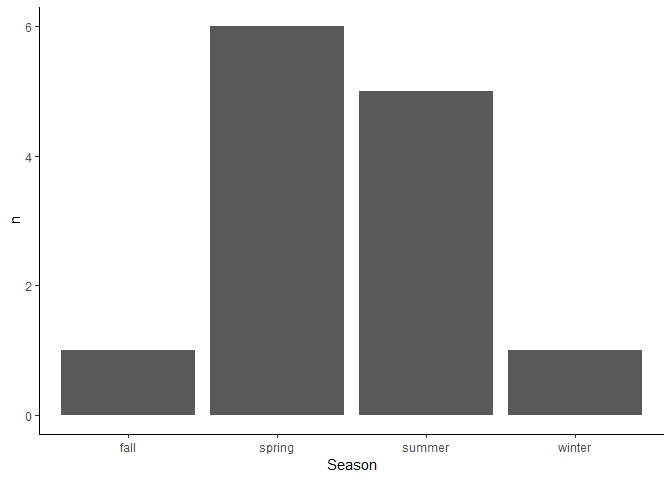
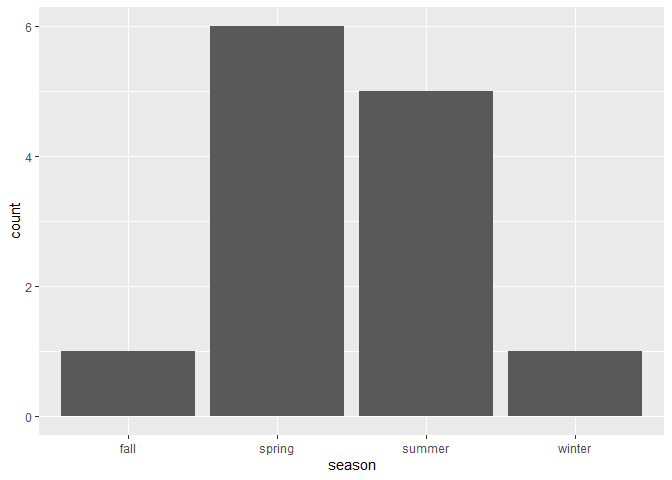
and I need to make a similar bar chart in ggplot
I don't know how to enter more than one variable on the x axis:
ggplot(dados, aes (x = spring, summer, fall, winter) + geom_bar() + theme_classic())
Error: Mapping should be created with aes() or aes_()`.
In addition: Warning message:
The plyr::rename operation has created duplicates for the following name(s): (``)