with that formulation, i takes the values in Y. So at the first occurence of the loop, i = 1000, at the second, i=801, etc...
If you want to use i as an index and run transect$Z_1[i] or similar (i.e. i is a row number), you may use one of those equivalent formulations:
for(i in 1:length(transect$Y))
for(i in 1:nrow(transect))
for(i in seq_along(transect(Y))
for(i in seq_len(nrow(transect))
So I don't expect your original code to give correct results (running it I indeed get the error that transect[i,k] is NA, since there aren't 1000 rows in transect).
But as @technocrat technocrat points out, this type of problem is much easier to solve in R by avoiding for loops and using data frame-level functions. Here I think you get something much easier if you pivot to a longer format:
library(tidyverse)
# Pivot to long format
long_transect <- transect %>%
pivot_longer(-Y,
names_to = "timestep",
names_prefix="Z_",
values_to = "Z") %>%
mutate(Z = if_else(abs(Z) < 10, 0, Z)) # say that <0 is =0
# Helper function, finds the first non-negative after the minimum
find_first_non_zero <- function(z_vector){
start_at <- which.min(z_vector) # the position of the minimum
if(z_vector[start_at] > 0){
warning("The lowest point is positive! Returning NA.")
return(NA)
}
subset_positions <- seq(start_at, length(z_vector))
pos <- first(which(z_vector[subset_positions] >= 0))
pos + start_at
}
# now, for each timestamp, compute index, Z and Y of interesting points
points_transect <- long_transect %>%
group_by(timestep) %>%
summarize(i_lowest_point = which.min(Z),
i_sea_level = find_first_non_zero(Z),
Z_lowest_point = Z[i_lowest_point],
Z_sea_level = Z[i_sea_level],
Y_lowest_point = Y[i_lowest_point],
Y_sea_level = Y[i_sea_level])
#> `summarise()` ungrouping output (override with `.groups` argument)
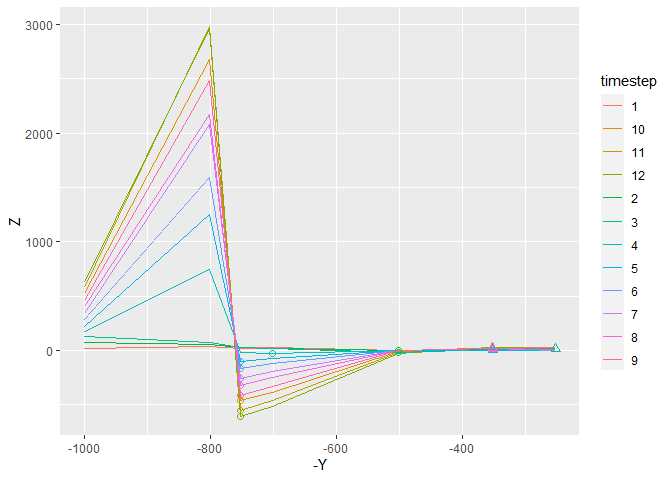
# We can plot it all together
ggplot(long_transect) +
geom_line(aes(y=Z, x=-Y, color = timestep)) +
geom_point(data = points_transect,
mapping = aes(x=-Y_lowest_point, y=Z_lowest_point, color = timestep),
shape = 1, size = 2, show.legend = FALSE) +
geom_point(data = points_transect,
mapping = aes(x=-Y_sea_level, y=Z_sea_level, color = timestep),
shape = 2, size = 2, show.legend = FALSE)
Created on 2020-12-18 by the reprex package (v0.3.0)
PS: for visualization, you can also try adding +facet_wrap(~timestep) to the ggplot definition, that helps see the individual timesteps.