Trouble merging lists of different lengths generated from nested 'if' loop

So I am a self-educated coder and my convoluted scripts show it. Sorry ahead of time. Hopefully, the comments help some.

I have numerous numerical models I am running which outputs 10's of data frames each, with x, y, and z spatial coordinates. Each dataframe is created for a different point in time. I am working on a spatial analysis through time and I am trying to isolate certain features and measure their changes. I have wrangled these dataframes into a singular dataframe per numerical model. This dataframe has one column (column 1) of y-coordinates and numerous columns of z-coordinates from each different timestep (column 2:ncol()).

I have some ugly nested loops that result in a bunch of lists being generated:

Example Data

  transect <- structure(list(Y = c(1000, 801, 751, 701, 501, 351, 251), Z_1 = c(16.1, 
   31.8, 14.4, 23.7, -0.9, 21.4, 29.9), Z_2 = c(73.9, 49.9, 27.5, 
   21.7, -7.7, 10.4, 18.2), Z_3 = c(124.1, 73.4, 26.7, 21.7, -16.3, 
   12.1, 15.3), Z_4 = c(174.6, 741.7, -16.6, -24.7, -6.1, 5.5, 5.4
   ), Z_5 = c(220.1, 1255.2, -105.4, -77, -5.4, 7.4, 8.1), Z_6 = c(282.9, 
   1595.3, -164.1, -121.8, -4.6, 18, 9.1), Z_7 = c(341, 2076.9, 
   -262.6, -196.5, -2.6, 15.8, 8.3), Z_8 = c(403.9, 2171.8, -323.4, 
   -253.3, -3.2, 17.3, 11.3), Z_9 = c(462.5, 2482.4, -415.3, -329.6, 
   -7.9, 20, 12), Z_10 = c(523.7, 2676.1, -460.9, -387.9, -12.9, 
   22.6, 15.4), Z_11 = c(577, 2979.2, -551.3, -459.5, -20.5, 27, 
   14.3), Z_12 = c(628.7, 2960.4, -603.8, -518.8, -30.5, 26.7, 16.2
   )), class = c("spec_tbl_df", "tbl_df", "tbl", "data.frame"), row.names = c(NA, 
   -7L), spec = structure(list(cols = list(Y = structure(list(), class = c("collector_double", 
   "collector")), Z_1 = structure(list(), class = c("collector_double", 
   "collector")), Z_2 = structure(list(), class = c("collector_double", 
   "collector")), Z_3 = structure(list(), class = c("collector_double", 
   "collector")), Z_4 = structure(list(), class = c("collector_double", 
   "collector")), Z_5 = structure(list(), class = c("collector_double", 
   "collector")), Z_6 = structure(list(), class = c("collector_double", 
   "collector")), Z_7 = structure(list(), class = c("collector_double", 
   "collector")), Z_8 = structure(list(), class = c("collector_double", 
   "collector")), Z_9 = structure(list(), class = c("collector_double", 
   "collector")), Z_10 = structure(list(), class = c("collector_double", 
   "collector")), Z_11 = structure(list(), class = c("collector_double", 
   "collector")), Z_12 = structure(list(), class = c("collector_double", 
   "collector"))), default = structure(list(), class = c("collector_guess", 
   "collector")), skip = 1L), class = "col_spec")))

Example Code

# parse through y-coordinates
for (i in transect$Y) {

# looks for elevation data within +-10 m of sea level along y-transect
if ( abs(transect$Z_3[i]) < 10) {

  # checks if values in range, along transect are on one side of a mountain range   
  if (transect$Y[which(transect$Z_3 == transect$Z_3[i])] < transect$Y[which(transect$Z_3 == min(transect$Z_3))]) {

       # returns to y-coordinate for the z-values in the range -- currently as lists that need to be merged.
       # take difference between the max returned y-coordinate and the base of the mountain range 
       print(cbind(transect$Y[which(transect$Z_3 == transect$Z_3[i])]))
         } 
     }
 }

prints

[1,] 349
[,1]
[1,] 350
[,1]
[1,] 351
[,1]
[1,] 352
[2,] 340
[,1]
[1,] 353
[,1]
[1,] 354
[2,] 56

I want to merge these lists as the loops iterate over each dataframe. I then plan to pick out the maximum returned value and do some mathing with it. The problem is when I try to merge these I am ending up with only the last value. I am assuming this is because I need to loop through dimensions of the object I am saving these lists too, but I can't think of a way to do this without messing up the structure of my ugly nested loops. Does anyone have any suggestions? Thank a million and let me know if this needs further clarification.

Note: Eventually, I need to replace the "transect$Z_3[i]" above with "transect[j][i]" so it's not just parsing through y-coordinates and analyzing elevation, but also parsing through time.

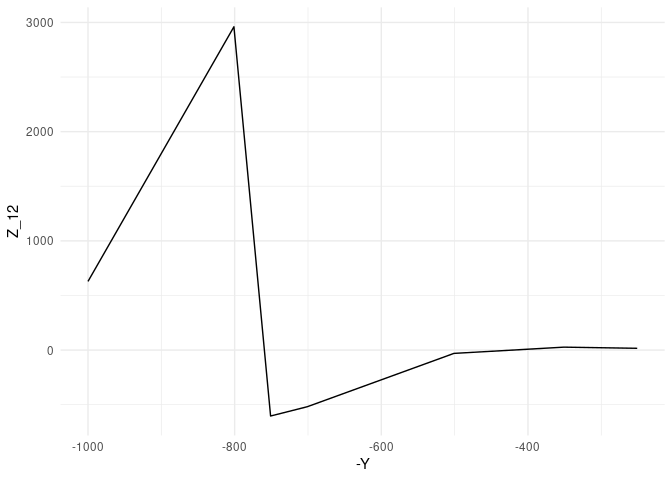
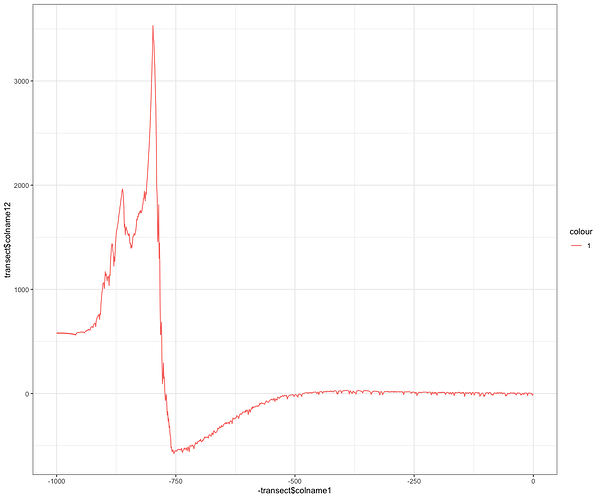
Here is what the actual data looks like when some column "Z_n" (Y-axis) is plotted against column "Y" (X-axis).

In a nut shell, I am trying to measure the difference in "Y" values between the point at the bottom of the curve (~ -750 on the x-axis) and where the gentle curve back up first hits zero (~ -500 on the x-axis). This needs to be iterated for each "Z_n" column.

To explain my objective graphically, I want to look at all the "Z_n" values on the basin side of the mountain -- this is the purpose of the min() in the code above. I am trying to find the first value where the basin shallows up to sea level, or in this case zero. To do this I apply the abs() to the data on the basin side to move the basin points from negative to positive. If I now look for the location of minimum"Z_n" values I should get the cell location of the surface where it crosses sea-level. I use the +-10 filter because in my actual data there is a lot of noise. From a list of "Y" values in the same row as the sea-level points found in "Z_n", the maximum of those should be the edge of this basin.

Update

I have realized that my first code could redo some of the logic and achieve a cleaner, more accurate measurement. Below is the updated code. However, while checking the y-coordinates an error is droped and the loop is exited.

Error in if (abs(transect[i, k]) < 10) { : argument is of length zero

Any help on this would be much appreciated!

temp <- data.frame(matrix(NA, ncol = 1))

# loops through each column (i.e. goes through each time period) 
for (k in 2:ncol(transect)) {

j = 0

print(k)

 # parses through y coordinates
 for (i in transect$Y) {

  # checks if y-values are within +-10 from 0 
  if (abs(transect[i, k]) < 10) {

    j = j + 1
    
    # meant to store the y- coordinates where  z-values within the 0+-10 range for a given timestep
    temp[j, k] <- rbind(max(transect$Y[which(transect[,k] == transect[i, k])]))

  }

 }
 
# arranges stored y-coordiantes 
# The largest of the stored values will be the point on the mountain that is near zero & the second largest 
# should be the value on the other side of basin shore. 
 temp <- temp %>% arrange(V2)

 # trying to make a dataframe that will store the basin width
 basin_length[, k] <- temp[nrow(temp),] - temp[nrow(temp) - 1,]
}

Hard to give a specific without a proper reprex bec.ause the data would need to be reversed engineered and, you'll have heard, R is a lazy evaluation language, so I get stuck at

Error in transect : object 'transect' not found

So, let's approach it abstractly.

It's useful to think of R as school algebra—f(x)=y$ where the three objects (in R everything is an object) are x, what's at hand, y, what's desired and f some function to make the transformation. Any or all of these objects can be composite and often the solution is as simple as composing an f from {base} functions or other packages.

To begin, x is transect is a data frame with a multiple variables named colnames_i \dots colnames_n. The return, y will be a vector of those values in colname1 that are associated with those values in colname33 that have an absolute value < 10.

There's are two functions for that in the {dplyr} package—filter and %>% (like the bash pipe | operator).

I'm first going to introduce two convenience values

strandline <- transect[abs(transect$colname33 ) < 10)
westing <- min(transect$column33)
transect %>% filter(colname1 < strandline & column1 == westing ) %>%
select(colname1)  -> X #some new collector object

Programmers coming to R from C and its progeny bring unsuitable attachment to control flow, which is not R's strong suit. Anything that requires heavy lifting is best done in C/C++ or Python and brought into the session with {Rcpp} or {reticulate}.

The specific problem you found with only getting the last iteration is a common illustration. The fix for those times when only a loop will to is to create a receiver object of appropriate size outside the loop and write each i to it.

1 Like

Thank you so much for your suggestions! I have edited my post with some example data you can copy into r and adjusted the code lines appropriately. I have also included a plot from my original data and a description of my goal in reference to the plot for a more visual explanation. I think my first explanation did not express my actual goal well. Hopefully this makes it more clear.

I think you are spot on with creating the object outside the loop to load the lists into, dimension by dimension. To do this, will I need to put another loop nested inside my code that looks something like this:

for (j in nrow(transect)) {
object[j] <- produced_lists
}

Thanks again.

Thanks. I'll take a look. The example text didn't have entries for the z_13 field. The preferred way of including data is to enter

dput(transect)

and cut and paste the output

# following line should be added to reflect the name of the object in the example code
transect <-

structure(list(Y = c(1000, 801, 751, 701, 501, 351, 251), Z_1 = c(16.1, 
31.8, 14.4, 23.7, -0.9, 21.4, 29.9), Z_2 = c(73.9, 49.9, 27.5, 
21.7, -7.7, 10.4, 18.2), Z_3 = c(124.1, 73.4, 26.7, 21.7, -16.3, 
12.1, 15.3), Z_4 = c(174.6, 741.7, -16.6, -24.7, -6.1, 5.5, 5.4
), Z_5 = c(220.1, 1255.2, -105.4, -77, -5.4, 7.4, 8.1), Z_6 = c(282.9, 
1595.3, -164.1, -121.8, -4.6, 18, 9.1), Z_7 = c(341, 2076.9, 
-262.6, -196.5, -2.6, 15.8, 8.3), Z_8 = c(403.9, 2171.8, -323.4, 
-253.3, -3.2, 17.3, 11.3), Z_9 = c(462.5, 2482.4, -415.3, -329.6, 
-7.9, 20, 12), Z_10 = c(523.7, 2676.1, -460.9, -387.9, -12.9, 
22.6, 15.4), Z_11 = c(577, 2979.2, -551.3, -459.5, -20.5, 27, 
14.3), Z_12 = c(628.7, 2960.4, -603.8, -518.8, -30.5, 26.7, 16.2
)), class = c("spec_tbl_df", "tbl_df", "tbl", "data.frame"), row.names = c(NA, 
-7L), spec = structure(list(cols = list(Y = structure(list(), class = c("collector_double", 
"collector")), Z_1 = structure(list(), class = c("collector_double", 
"collector")), Z_2 = structure(list(), class = c("collector_double", 
"collector")), Z_3 = structure(list(), class = c("collector_double", 
"collector")), Z_4 = structure(list(), class = c("collector_double", 
"collector")), Z_5 = structure(list(), class = c("collector_double", 
"collector")), Z_6 = structure(list(), class = c("collector_double", 
"collector")), Z_7 = structure(list(), class = c("collector_double", 
"collector")), Z_8 = structure(list(), class = c("collector_double", 
"collector")), Z_9 = structure(list(), class = c("collector_double", 
"collector")), Z_10 = structure(list(), class = c("collector_double", 
"collector")), Z_11 = structure(list(), class = c("collector_double", 
"collector")), Z_12 = structure(list(), class = c("collector_double", 
"collector"))), default = structure(list(), class = c("collector_guess", 
"collector")), skip = 1L), class = "col_spec"))

I'll take a look. Do you have a datum for the paleo strand-line? For, example, in the first record (Y = 1000), min_{z_{1..12}} = 16.1 So 16.1± 10 is the correct value?

1 Like

Thanks for the reply and helping me figure out posting on the forum and organizing my sample data. I have since made progress to only have ran into a new issue. It's stated in the Updated section of my original post with the newest lines of script.

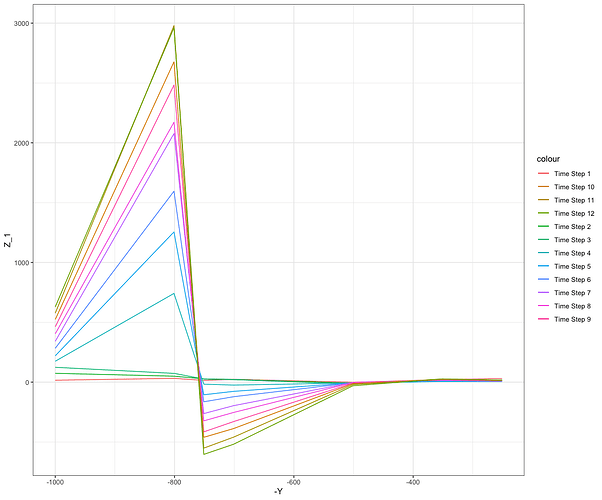
No, your example is not correct. It sounds like you took the min of the row rather than the column. Each column after the first is a different step in time and each row is a z-coordinate. The first column is coordinates along a transect. I would like to evaluate all z-coordiantes (all rows) for each step in time (each column after the first) in reference to their y-location (first column). This may help with the visualization:

ggplot(test ,aes(x = -Y)) +
 geom_line(aes(y = Z_1, color = "Time Step 1")) +
 geom_line(aes(y = Z_2, color = "Time Step 2")) +
 geom_line(aes(y = Z_3, color = "Time Step 3")) +
 geom_line(aes(y = Z_4, color = "Time Step 4")) +
 geom_line(aes(y = Z_5, color = "Time Step 5")) +
 geom_line(aes(y = Z_6, color = "Time Step 6")) +
 geom_line(aes(y = Z_7, color = "Time Step 7")) +
 geom_line(aes(y = Z_8, color = "Time Step 8")) +
 geom_line(aes(y = Z_9, color = "Time Step 9")) +
 geom_line(aes(y = Z_10, color = "Time Step 10")) +
 geom_line(aes(y = Z_11, color = "Time Step 11")) +
 geom_line(aes(y = Z_12, color = "Time Step 12")) 

1 Like

Thanks. I am still unsure of your intent, particularly as it regards the abs/min test

suppressPackageStartupMessages({
  library(dplyr)
  library(ggplot2)
})

# FUNCTIONS

#  absolute minimum values of Zs
find_absmin <- function(x) abs(min(x))

# DATA
t <- structure(list(Y = c(1000, 801, 751, 701, 501, 351, 251), Z_1 = c(
  16.1,
  31.8, 14.4, 23.7, -0.9, 21.4, 29.9
), Z_2 = c(
  73.9, 49.9, 27.5,
  21.7, -7.7, 10.4, 18.2
), Z_3 = c(
  124.1, 73.4, 26.7, 21.7, -16.3,
  12.1, 15.3
), Z_4 = c(174.6, 741.7, -16.6, -24.7, -6.1, 5.5, 5.4), Z_5 = c(220.1, 1255.2, -105.4, -77, -5.4, 7.4, 8.1), Z_6 = c(
  282.9,
  1595.3, -164.1, -121.8, -4.6, 18, 9.1
), Z_7 = c(
  341, 2076.9,
  -262.6, -196.5, -2.6, 15.8, 8.3
), Z_8 = c(
  403.9, 2171.8, -323.4,
  -253.3, -3.2, 17.3, 11.3
), Z_9 = c(
  462.5, 2482.4, -415.3, -329.6,
  -7.9, 20, 12
), Z_10 = c(
  523.7, 2676.1, -460.9, -387.9, -12.9,
  22.6, 15.4
), Z_11 = c(
  577, 2979.2, -551.3, -459.5, -20.5, 27,
  14.3
), Z_12 = c(628.7, 2960.4, -603.8, -518.8, -30.5, 26.7, 16.2)), class = c("spec_tbl_df", "tbl_df", "tbl", "data.frame"), row.names = c(
  NA,
  -7L
), spec = structure(list(cols = list(Y = structure(list(), class = c(
  "collector_double",
  "collector"
)), Z_1 = structure(list(), class = c(
  "collector_double",
  "collector"
)), Z_2 = structure(list(), class = c(
  "collector_double",
  "collector"
)), Z_3 = structure(list(), class = c(
  "collector_double",
  "collector"
)), Z_4 = structure(list(), class = c(
  "collector_double",
  "collector"
)), Z_5 = structure(list(), class = c(
  "collector_double",
  "collector"
)), Z_6 = structure(list(), class = c(
  "collector_double",
  "collector"
)), Z_7 = structure(list(), class = c(
  "collector_double",
  "collector"
)), Z_8 = structure(list(), class = c(
  "collector_double",
  "collector"
)), Z_9 = structure(list(), class = c(
  "collector_double",
  "collector"
)), Z_10 = structure(list(), class = c(
  "collector_double",
  "collector"
)), Z_11 = structure(list(), class = c(
  "collector_double",
  "collector"
)), Z_12 = structure(list(), class = c(
  "collector_double",
  "collector"
))), default = structure(list(), class = c(
  "collector_guess",
  "collector"
)), skip = 1L), class = "col_spec"))


# MAIN

#  which columns have an abolute minimum value < 10?

apply(t[2:13],2,abs) %>% apply(.,2,min) < 10 
#>   Z_1   Z_2   Z_3   Z_4   Z_5   Z_6   Z_7   Z_8   Z_9  Z_10  Z_11  Z_12 
#>  TRUE  TRUE FALSE  TRUE  TRUE  TRUE  TRUE  TRUE  TRUE FALSE FALSE FALSE

# therefore, Z_3, Z_10, Z_11 and Z_12 should be excluded
# however, the plot given includes those values and
# logic remains unclear

p <- ggplot(t,aes(-Y,Z_12)) + geom_line() + theme_minimal()
p

Created on 2020-12-18 by the reprex package (v0.3.0.9001)

with that formulation, i takes the values in Y. So at the first occurence of the loop, i = 1000, at the second, i=801, etc...
If you want to use i as an index and run transect$Z_1[i] or similar (i.e. i is a row number), you may use one of those equivalent formulations:

for(i in 1:length(transect$Y))
for(i in 1:nrow(transect))
for(i in seq_along(transect(Y))
for(i in seq_len(nrow(transect))

So I don't expect your original code to give correct results (running it I indeed get the error that transect[i,k] is NA, since there aren't 1000 rows in transect).

But as @technocrat technocrat points out, this type of problem is much easier to solve in R by avoiding for loops and using data frame-level functions. Here I think you get something much easier if you pivot to a longer format:

library(tidyverse)

# Pivot to long format
long_transect <- transect %>%
  pivot_longer(-Y,
               names_to = "timestep",
               names_prefix="Z_",
               values_to = "Z") %>%
  mutate(Z = if_else(abs(Z) < 10, 0, Z)) # say that <0 is =0


# Helper function, finds the first non-negative after the minimum
find_first_non_zero <- function(z_vector){
  
  start_at <- which.min(z_vector) # the position of the minimum
  
  if(z_vector[start_at] > 0){
    warning("The lowest point is positive! Returning NA.")
    return(NA)
  }
  
  subset_positions <- seq(start_at, length(z_vector))
  
  pos <- first(which(z_vector[subset_positions] >= 0))
  pos + start_at
}

# now, for each timestamp, compute index, Z and Y of interesting points
points_transect <- long_transect %>%
  group_by(timestep) %>%
  summarize(i_lowest_point = which.min(Z),
            i_sea_level = find_first_non_zero(Z),
            Z_lowest_point = Z[i_lowest_point],
            Z_sea_level = Z[i_sea_level],
            Y_lowest_point = Y[i_lowest_point],
            Y_sea_level = Y[i_sea_level])
#> `summarise()` ungrouping output (override with `.groups` argument)


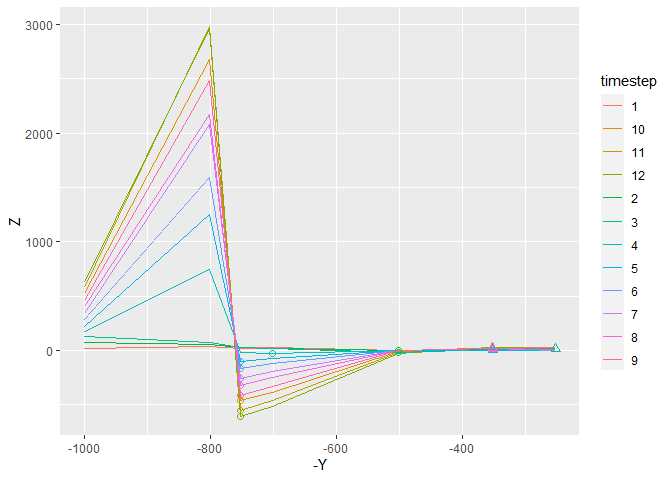
# We can plot it all together
ggplot(long_transect) +
  geom_line(aes(y=Z, x=-Y, color = timestep)) +
  geom_point(data = points_transect,
             mapping = aes(x=-Y_lowest_point, y=Z_lowest_point, color = timestep),
             shape = 1, size = 2, show.legend = FALSE) +
  geom_point(data = points_transect,
             mapping = aes(x=-Y_sea_level, y=Z_sea_level, color = timestep),
             shape = 2, size = 2, show.legend = FALSE)

Created on 2020-12-18 by the reprex package (v0.3.0)

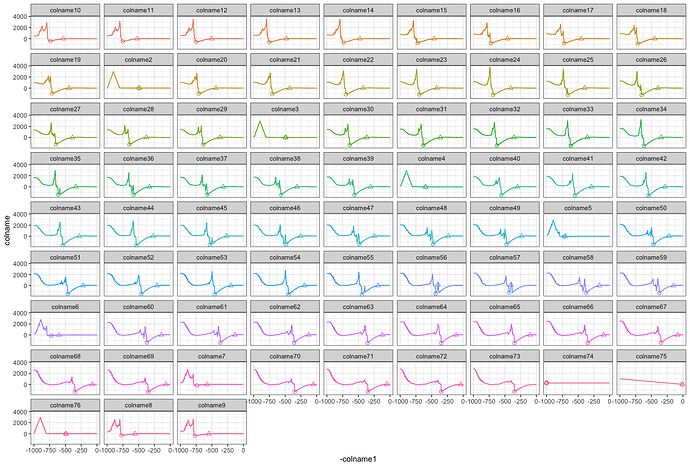
PS: for visualization, you can also try adding +facet_wrap(~timestep) to the ggplot definition, that helps see the individual timesteps.

1 Like

Thank you very much for the assistance and persevering through my poor descriptions. I don't really understand the processes of the functions you used but I can look them up and do some reading. I do have a few minor adjustment I am curious about when I apply this to my actual data.

First off, is there a way to get facet_wrap() to organize this in sequential order instead of 1, 10, 11, 12 ... 2, 20, 21, 21 ... etc?

Second, if you look at plots in groups of 10's starting at "colname5", you will notice a new peak forms in the basin (the low trough of negative values). Each time one of these new peaks forms, I am trying to look for the points of interest from the base of the new peak towards the shore. This was my intent for the min() logic. It seems to have worked in most all cases except in the timeseteps relating to plots 55, 56, 57. Do you have any suggestions on how to achieve this by way of a different logic than looking at the minimum z value?

Lastly, I plan to take the difference between these points interest picked by this code and load them into a new dataframe while removing an instances where the difference is zero (plots 2, 3, 4, 74, 75, 76). My instincts say to go through this process with another if loop... would that be another instance of me being inefficient?

Yes, if timestep is an ordered factor, the order will be used by ggplot. So you can try to add timestep = fct_inorder(timestep) in the mutate statement, just after the pivot.

I don't totally understand. Can you provide the data for colname55 and the exact coordinates you expect to recover? There should be ways to obtain peaks, using for example the package peakPick or one of the many others, possibly restricting first the range in which to look. So it should definitely be possible, the difficulty is to define the objective in the right way.

In that case, yes. To compute such a difference, you can just use the fact that subtraction is already vectorized, for example:

c(4,5,6) - c(1,7,3)
#> [1]  3 -2  3

So you can simply use a mutate after the summarize:

mutate(difference = Y_sea_level - Y_lowest_point)

And after that you can use filter(difference != 0) to remove the timesteps that you don't want.

1 Like

All of these work rather slick. I liked using mutate rather than cbind().

Here are data for timesteps 55, and 56.

transect <- structure(data.frame(Y = c(1000:0), 
                     Z_55 = c(2201.3, 2204.7, 2201.3, 2204.7, 2201.3, 2204.6, 2201.3, 2204.6, 
                                   2201.3, 2204.6, 2201.4, 2204.6, 2201.5, 2204.6, 2201.6, 2204.7, 
                                   2201.8, 2204.8, 2202, 2204.9, 2202.2, 2204.5, 2202.5, 2204.7, 
                                   2202.9, 2205.1, 2203.3, 2205.3, 2203.7, 2205.3, 2204.2, 2203.7, 
                                   2204.7, 2203, 2205.2, 2201.2, 2199.5, 2196.5, 2199, 2197.1, 2202.7, 
                                   2196.3, 2191.5, 2179.7, 2165.3, 2161, 2168.4, 2156.7, 2164.4, 
                                   2138.4, 2109.8, 2086.5, 2046.4, 2049, 2067.8, 2051.6, 2076.9, 
                                   2080.5, 2113.5, 2092.8, 2082.1, 2049.2, 2004.2, 1965.7, 1898.6, 
                                   1905, 1914.7, 1940.1, 2000, 1990.2, 1990.2, 1950.8, 1898, 1852.6, 
                                   1774.3, 1793.6, 1825.9, 1834.4, 1890.9, 1874.2, 1867.2, 1823.7, 
                                   1762.9, 1713.7, 1606.9, 1618.3, 1557.1, 1595.3, 1655.5, 1639.7, 
                                   1686.3, 1635.9, 1583, 1521.6, 1417, 1455.3, 1518.5, 1512.4, 1582.1, 
                                   1566.5, 1606.8, 1528.1, 1528.3, 1443.5, 1384.9, 1355.5, 1286.2, 
                                   1230.9, 1118.2, 1164.5, 1229.7, 1209.3, 1276.6, 1226.8, 1204.1, 
                                   1151.6, 1073.1, 1004.9, 891.5, 935.5, 1009.7, 992.4, 1065.1, 
                                   1024.7, 1022.9, 969.5, 899.6, 848.7, 725.9, 755.1, 682.3, 711.7, 
                                   641.6, 671.1, 602.6, 632.8, 566.3, 597.3, 534.1, 564.1, 503.1, 
                                   530.8, 472.2, 492.9, 442.6, 488.2, 545.5, 539.7, 586.8, 564.9, 
                                   527.3, 527.2, 466.2, 501.6, 494.6, 484.6, 461.6, 466.6, 452.4, 
                                   442.5, 406.8, 406.8, 395.9, 386.8, 360.7, 362.4, 332.2, 313.4, 
                                   251.6, 289.6, 283.3, 270.4, 215.1, 262.6, 268.3, 271, 243.8, 
                                   232.4, 187.5, 212.9, 205.7, 196.5, 158.2, 188.4, 188, 186.2, 
                                   150.4, 173.1, 163.5, 158.6, 124.8, 146.3, 140.5, 134.4, 104.8, 
                                   124.4, 121.4, 116.9, 91.2, 107.8, 105.1, 103, 81.8, 95.4, 91.2, 
                                   89.4, 71.5, 82.9, 79.3, 77.8, 63, 72.1, 69.1, 67.8, 55.6, 63, 
                                   60.3, 59, 48.9, 51.9, 47.3, 44.5, 35.9, 36.9, 33.7, 33.7, 32.1, 
                                   31.7, 30.6, 30.5, 29.5, 29.4, 28.3, 28.2, 27.2, 27.1, 26.3, 26.2, 
                                   25.2, 25.3, 24.3, 24.4, 23.5, 23.8, 23.2, 23.4, 22.5, 22.9, 22.2, 
                                   22.8, 22.2, 22.7, 21.9, 22.4, 21.5, 22.3, 21.7, 22.4, 21.8, 23, 
                                   24.5, 23.7, 24.7, 23.7, 24.4, 23.6, 23.8, 24.1, 25.7, 24.5, 24.7, 
                                   24.7, 26.2, 25.3, 26.4, 25.7, 26.8, 26.6, 28.1, 27.6, 28.7, 29, 
                                   30.5, 29.9, 29.9, 31.2, 32.8, 33.4, 34.5, 35, 35.7, 36.1, 36.8, 
                                   37, 37.5, 37.9, 38.4, 39.1, 39.6, 40.4, 41, 41.8, 42.4, 43.3, 
                                   43.8, 44.8, 45.3, 46.7, 47.9, 48.4, 49.8, 49.8, 50.8, 51.7, 53.3, 
                                   54.7, 57, 58, 60, 60.5, 61.4, 62.1, 62.7, 62.9, 61.7, 64, 64, 
                                   66.9, 67.6, 71, 73, 74.1, 73.8, 72.4, 67.3, 69.8, 67.2, 74.3, 
                                   78, 81.1, 82.9, 84.4, 86, 85.8, 85.8, 87.5, 87.7, 89.6, 89.7, 
                                   91.6, 91.3, 94.1, 93.5, 97.8, 100.1, 102.8, 104.1, 104.5, 101.7, 
                                   105.1, 103.8, 107.3, 108.2, 111.1, 111.6, 115.8, 115, 119.7, 
                                   123, 125, 129.4, 132.1, 133.8, 135.9, 131.4, 140.5, 149.4, 148.9, 
                                   155, 155.6, 160.1, 160.2, 163.1, 161, 161.1, 160.7, 161.5, 162.2, 
                                   163.2, 166.1, 169, 173, 177.2, 177.9, 180.8, 175.7, 173.3, 175.7, 
                                   181.8, 181.2, 185.8, 185.4, 189.5, 189.8, 194, 195.5, 199.7, 
                                   200.8, 202.9, 203.5, 203.8, 205.6, 207.7, 209.1, 212.6, 211.6, 
                                   211, 209.8, 205, 208.3, 206.3, 210.4, 209.6, 209.6, 205.9, 208.6, 
                                   207.3, 211.8, 215.7, 216.9, 223.7, 220.3, 219.5, 228, 233.1, 
                                   245.1, 257.2, 257.5, 267.8, 268.5, 283.3, 289.2, 303.4, 299.4, 
                                   296.9, 290.5, 279.3, 281.2, 271.5, 280.6, 278.4, 286.6, 281.7, 
                                   294.4, 284.6, 300.9, 287.4, 313.1, 335.5, 340.7, 380.3, 371, 
                                   412.8, 390.4, 430.6, 375.8, 327.4, 353.1, 354.6, 394.7, 394.3, 
                                   464, 440.4, 504.9, 503.5, 568.1, 581.8, 654.3, 659.9, 719.1, 
                                   720.4, 766.6, 764.8, 806.7, 807.6, 850.3, 864.9, 916.5, 950, 
                                   1021, 1076.8, 1106.2, 1125.3, 1171, 1213.4, 1254.3, 1299.3, 1294.3, 
                                   1255.9, 1357.1, 1379.3, 1555, 1683.1, 1875.1, 2113.3, 2143, 2387.8, 
                                   2262.7, 2403, 2169.5, 2176.1, 1900.3, 1914.1, 1588.1, 1540.2, 
                                   1206.6, 1095.7, 781.7, 516, 410.1, 237.4, 252.8, 158.1, 307.4, 
                                   367.8, 323.2, 288, 230.5, 185.5, 116.8, 59.4, 24.2, 28.2, -26.3, 
                                   -43.9, -50.3, -76.1, -68.5, -108.1, -98.2, -126.1, -115.5, -128.1, 
                                   -117.6, -107.7, -125.2, -121.6, -140.1, -136.8, -188.2, -224.7, 
                                   -373.3, -514, -760.4, -1005.4, -1316.7, -1626.7, -1608.6, -1587.7, 
                                   -1533.1, -1472.6, -1457.7, -1428.4, -1423.9, -1406.9, -1399.5, 
                                   -1388.2, -1382.1, -1370.8, -1367.8, -1354.9, -1357.3, -1354.9, 
                                   -1345.5, -1335.4, -1320.9, -1307.3, -1302.7, -1305, -1288.8, 
                                   -1272.5, -1252.6, -1227.1, -1169.7, -1111.7, -1089.8, -1068.5, 
                                   -1058.8, -1049.8, -1038.9, -1032.2, -1020.3, -1012, -966.3, -930.5, 
                                   -821, -726.6, -667.1, -612.7, -520.8, -430, -271.8, -116.5, -347.9, 
                                   -577.9, -891.2, -1198.6, -1192.7, -1181, -1177.1, -1164.5, -1161.6, 
                                   -1149.3, -1149.3, -1151.5, -1133.4, -1126.6, -1110.1, -1102, 
                                   -1095.4, -1099.1, -1081.6, -1070, -1058.1, -1042.2, -1036.3, 
                                   -1024.7, -1022.1, -1016.5, -1006.4, -1000.5, -986.7, -977.4, 
                                   -968.9, -961, -952.3, -945.7, -932.8, -925.7, -907.3, -893.6, 
                                   -888.2, -880.1, -872.4, -857.6, -855.5, -851.4, -841, -834.4, 
                                   -820.9, -806, -803.6, -796.8, -786, -770.2, -768.2, -765.5, -752.1, 
                                   -738.2, -740.6, -746.1, -725, -707.1, -701.3, -687.8, -686.4, 
                                   -679, -673.3, -669.8, -654.6, -642.4, -639.1, -636.5, -626.9, 
                                   -622.8, -612.4, -599.9, -599.9, -595.2, -585.5, -576.3, -567, 
                                   -559.6, -553.3, -551.9, -540.8, -531.2, -520.4, -508, -507.5, 
                                   -505.1, -493.9, -480.3, -475.8, -471.3, -465.5, -458, -455.8, 
                                   -450.2, -442.1, -432.9, -429.7, -425.7, -419.3, -413.5, -409.3, 
                                   -407.6, -399.5, -391.2, -386.5, -379.9, -372.8, -365.8, -360.2, 
                                   -353.7, -347.7, -341.8, -337.4, -336, -327.7, -320.4, -315.3, 
                                   -308.6, -304.4, -298.5, -295, -288, -285.5, -281.1, -275.7, -268.7, 
                                   -265.2, -258, -254.9, -247.5, -245.2, -238.5, -235.8, -228.9, 
                                   -226, -218.8, -216.2, -209.2, -207, -202.4, -198.7, -193.2, -190.7, 
                                   -186.5, -181.4, -176.4, -174.1, -173.6, -167.3, -163.9, -162.9, 
                                   -166.6, -158.2, -155.8, -150.3, -149.5, -143, -141.1, -134, -128.1, 
                                   -124.2, -118.8, -115.5, -112.1, -108.3, -105.1, -101.5, -99.1, 
                                   -97.6, -98.8, -92.6, -87.9, -85.3, -82.9, -80.3, -80.5, -73.9, 
                                   -69.5, -67.2, -65.5, -65, -67.4, -60.7, -56.9, -53.7, -50.7, 
                                   -50.9, -48.4, -48.6, -44.2, -44.7, -40.3, -43.1, -43.2, -39.4, 
                                   -36.2, -31.5, -27.6, -26.2, -24.6, -25.4, -27.9, -23.5, -19.2, 
                                   -17.7, -13.5, -12.4, -9.7, -10.7, -8.8, -11.5, -13.4, -8.9, -4.5, 
                                   -2.5, 1.2, 2.5, 3.9, 5, 5.4, 7.6, 8.3, 9.9, 9.9, 13.2, 16.2, 
                                   14.5, 16, 12.7, 11.3, 17.1, 21.8, 24.5, 27.6, 29.3, 31.4, 32.8, 
                                   34.2, 32.3, 27.8, 31, 31.9, 34.1, 35.1, 38.6, 44.1, 43.2, 47.9, 
                                   45.1, 50.1, 37.4, 22, 42.4, 53.7, 54.2, 53.7, 53.6, 55.6, 54.2, 
                                   54.3, 57.4, 60.7, 60.6, 62.1, 53.7, 43, 53.9, 63.8, 63.5, 64.8, 
                                   53.1, 43.6, 53.4, 65.4, 65.5, 65.6, 65.6, 65.9, 64.3, 61.4, 64.9, 
                                   66.8, 55.6, 34.4, 49.2, 48.2, 59.3, 64, 65.3, 65.2, 56.6, 37.9, 
                                   44.8, 37.2, 55.3, 68, 68.5, 68.8, 69.2, 69.3, 66.2, 59.8, 66.4, 
                                   69.9, 70.1, 70.2, 61.7, 49.8, 54.9, 50.6, 56.7, 50.8, 63.5, 70.1, 
                                   69.8, 69.1, 67.5, 63.5, 67.8, 70.1, 65.5, 70.1, 65.5, 70, 69.7, 
                                   70, 66.2, 69.9, 66.4, 69.7, 66.4, 60.3, 66.1, 69.1, 68.5, 67.5, 
                                   56.9, 39.3, 49.5, 46.3, 56.2, 65.8, 62.1, 63.4, 61.9, 65.7, 63.5, 
                                   67.9, 67.9, 67.9, 67.3, 67.5, 67.2, 67.7, 63.3, 67.5, 62.8, 66.4, 
                                   58.9, 50.6, 58.4, 66.2, 66.5, 67.3, 66.7, 65.7, 66.2, 67.2, 60.6, 
                                   49.6, 56.6, 54.7, 62.3, 66.2, 61.5, 54.9, 61.4, 66, 65.7, 65.6, 
                                   65.2, 64.9, 58.1, 45.4, 57.6, 63.9, 63.5, 63.1, 62.8, 62.8, 62.3, 
                                   62, 55.2, 47.1, 53.1, 62), 
                     Z_56 = c(2212.2, 2215.6, 2212.2, 2215.5, 2212.2, 2215.5, 2212.2, 2215.5, 
                                   2212.3, 2215.5, 2212.3, 2215.5, 2212.4, 2215.6, 2212.6, 2215.7, 
                                   2212.7, 2215.8, 2213, 2215.9, 2213.2, 2216.1, 2213.6, 2216.3, 
                                   2213.9, 2216.2, 2214.4, 2215.6, 2214.8, 2215.8, 2215.3, 2216.6, 
                                   2215.9, 2216.9, 2216.5, 2214.9, 2212.3, 2210.2, 2212.3, 2209.2, 
                                   2214.8, 2205.9, 2203.5, 2197.4, 2201.3, 2198.4, 2207.1, 2195, 
                                   2185.7, 2166.1, 2142.7, 2136.6, 2148.3, 2130.4, 2141, 2102.8, 
                                   2058.4, 2037.4, 1986.1, 2003, 2033.9, 2014.2, 2042.9, 2047.1, 
                                   2084.6, 2058.2, 2041.1, 2007.1, 1957, 1911.9, 1833.8, 1851.3, 
                                   1877.7, 1892.1, 1951.5, 1940, 1938.3, 1897.5, 1840.8, 1790.2, 
                                   1704, 1729.4, 1772.7, 1773.8, 1831.2, 1811.1, 1800, 1753.8, 1686.6, 
                                   1633.3, 1517.1, 1530.7, 1465.3, 1507.3, 1572.3, 1556.3, 1607.5, 
                                   1553.6, 1497.6, 1433, 1322.5, 1363.5, 1430.2, 1423, 1495.2, 1469.2, 
                                   1498.1, 1412.2, 1416.7, 1340.5, 1311.7, 1270, 1197.4, 1137.5, 
                                   1021.4, 1067.9, 1133.2, 1113, 1180.9, 1130.6, 1107.6, 1054.8, 
                                   975.7, 907.9, 795, 838.8, 912.5, 895.5, 967.7, 927.5, 925.3, 
                                   872.5, 803.1, 753.1, 632.1, 661.4, 590.4, 619.7, 551.8, 581, 
                                   515, 544.6, 481.1, 511.4, 451.4, 480.7, 423.6, 450.7, 397, 417.6, 
                                   373.1, 415, 466.3, 461.9, 504.1, 482.5, 446.4, 435.1, 359, 412, 
                                   415.1, 409.1, 387.1, 393.4, 378.6, 371.5, 336.5, 339.6, 327, 
                                   321.2, 294.4, 297.2, 268, 250.4, 194.5, 228.5, 223.2, 208.9, 
                                   160, 201.6, 208.5, 213.6, 190.2, 179.2, 138.3, 161.2, 155.7, 
                                   145.5, 111, 137.8, 139, 137.2, 104.5, 125.5, 117.5, 110.8, 80.8, 
                                   100, 97.8, 91.4, 66.2, 83, 82.1, 77, 55.6, 69.9, 69.1, 67.3, 
                                   49.7, 61.2, 58, 56.7, 42.1, 51.4, 48.3, 47, 34.9, 42.3, 39.9, 
                                   38.6, 28.5, 34.6, 32.8, 31.7, 23.5, 25.7, 22.3, 20.4, 14.8, 15.4, 
                                   12.9, 13, 11.5, 11.3, 10.4, 10.4, 9.6, 9.6, 8.7, 8.7, 7.9, 8, 
                                   7.4, 7.5, 6.7, 6.9, 6.1, 6.4, 5.7, 6.2, 5.7, 6.1, 5.4, 6.1, 5.6, 
                                   6.4, 6, 6.7, 6.1, 6.8, 6.1, 7.2, 6.8, 7.7, 7.4, 8.8, 10.5, 9.9, 
                                   11.1, 10.4, 11.4, 10.8, 11.2, 11.8, 13.6, 12.6, 13.1, 13.3, 15.1, 
                                   14.4, 15.7, 15.3, 16.6, 16.7, 18.5, 18.2, 19.6, 20, 21.9, 21.5, 
                                   21.8, 23.3, 25.2, 25.7, 26.3, 27.3, 27.9, 28.9, 29.7, 30.6, 31.3, 
                                   32, 32.8, 33.6, 34.5, 35.4, 36.3, 37.2, 38.2, 39.2, 40.2, 41.1, 
                                   42.3, 43.1, 44.2, 45.1, 46.5, 47, 48.7, 49.5, 51.7, 52.9, 55.8, 
                                   56.5, 58.8, 59.5, 61.2, 61.9, 62.9, 63.2, 62.6, 64.4, 64, 66.8, 
                                   66.9, 70.9, 72.7, 75.2, 75.9, 75.5, 71.7, 74.3, 72.1, 78.4, 81.6, 
                                   84.1, 84.8, 87.7, 89.6, 91.1, 92.5, 93.9, 94.9, 96.3, 97.2, 98.8, 
                                   99.3, 101.7, 101.9, 105.9, 108.9, 109.6, 109.3, 112, 111.4, 114.6, 
                                   113.9, 117.2, 118.7, 121.1, 122.5, 125.3, 125.2, 127.8, 127.9, 
                                   132.9, 137.9, 140.4, 142.7, 143.5, 138.9, 147.8, 155.6, 155.6, 
                                   162.4, 162.6, 168.4, 168.5, 173.3, 171.6, 174.5, 174.1, 175.9, 
                                   176.3, 177.8, 179.2, 181.2, 184.7, 188.7, 190, 193.4, 189.8, 
                                   188.8, 190, 194, 193.4, 196.7, 196.5, 200.4, 201.2, 206.2, 207.2, 
                                   211.8, 213.4, 216.8, 217.1, 218.3, 219.2, 221.5, 222.4, 225.8, 
                                   225.3, 225.6, 224.6, 221.4, 223.6, 222.2, 225.1, 224.4, 224.8, 
                                   222.5, 224.5, 223.8, 226.5, 228.5, 230, 235.2, 232.3, 231.6, 
                                   238.3, 242.6, 252.7, 262.3, 264, 273.2, 273.7, 286.2, 290.9, 
                                   303.8, 301.4, 301.5, 296.3, 289.5, 288.5, 280.5, 286.6, 284, 
                                   292.6, 292.8, 301.2, 294.9, 306.5, 297, 316.5, 332.4, 335.3, 
                                   360.6, 354.5, 383.3, 367.8, 396.3, 360.6, 330.4, 351.3, 354.3, 
                                   371, 356.9, 401.6, 371.4, 419.3, 408, 465.7, 462.6, 544.6, 533.4, 
                                   617, 613.5, 687.2, 692.7, 751.4, 760.4, 808, 824.8, 873, 899.9, 
                                   962.5, 1008.5, 1019.1, 1022.4, 1058.3, 1092.6, 1128.1, 1166, 
                                   1151.6, 1096.7, 1197.7, 1217, 1335.9, 1383.8, 1591.5, 1812.5, 
                                   1820.1, 2023.9, 1915.6, 2063.8, 1797.8, 1804.3, 1469.9, 1498, 
                                   1118.4, 1126.4, 751.9, 708, 413.2, 197.4, 186.6, 132.4, 139.5, 
                                   125.6, 188.5, 218.9, 187.1, 165.4, 127, 97.5, 57.3, 23.5, -6.1, 
                                   0.6, -54.6, -73, -80.2, -106.8, -99.9, -140.3, -131.2, -159.8, 
                                   -150, -163.4, -153.6, -144.5, -162.7, -159.9, -179.1, -176.6, 
                                   -228.7, -266, -394.4, -514.8, -720.4, -924.5, -1194.8, -1463.8, 
                                   -1425.6, -1384.7, -1330.6, -1270.8, -1256.5, -1227.9, -1224, 
                                   -1207.5, -1200.7, -1190.1, -1184.6, -1173.9, -1171.4, -1159.1, 
                                   -1162, -1160.1, -1151.3, -1141.8, -1106.7, -1072.5, -1027, -988.1, 
                                   -930.6, -873, -832.9, -787.2, -729.8, -672.2, -650.7, -629.9, 
                                   -578.5, -527.7, -434.2, -344.6, -249.6, -158.4, 12.3, 173.1, 
                                   336.2, 476.9, 310.8, 128, 88.8, 38.7, -66.1, -178.6, -411.4, 
                                   -641.3, -956.7, -1264.4, -1265.2, -1265.5, -1249.9, -1233.1, 
                                   -1228.9, -1218.7, -1213.1, -1210, -1198.6, -1191, -1178.2, -1169, 
                                   -1158.7, -1156.8, -1149.1, -1149.4, -1127.7, -1106.4, -1100.6, 
                                   -1089.5, -1079.6, -1069.2, -1063.2, -1063.7, -1048.8, -1038.4, 
                                   -1030.6, -1022.6, -1014.4, -1006.2, -994.5, -985, -967.3, -950.8, 
                                   -946.2, -937.7, -931, -919.1, -915.2, -911.1, -900, -892.6, -878.8, 
                                   -862, -861.1, -854.5, -848.5, -841.5, -831.6, -825.8, -810.6, 
                                   -796.3, -792.9, -789.1, -774.7, -760, -754.2, -740.9, -739.5, 
                                   -730.5, -726.3, -721.7, -708.7, -694, -696.7, -702.3, -682, -673.5, 
                                   -662.2, -654.1, -649.3, -642.8, -634, -624.4, -612.2, -600.8, 
                                   -592.7, -584.3, -580.1, -572.4, -562.3, -549, -549.9, -548.4, 
                                   -537, -523.6, -518.4, -514.3, -507.5, -499.4, -497.2, -492.1, 
                                   -485.9, -481.1, -474.1, -467.4, -461.3, -455.4, -446.8, -438.7, 
                                   -432.3, -424.8, -417.9, -410.7, -406.6, -404.7, -395.9, -387.7, 
                                   -381.9, -374.5, -369.4, -363.1, -358.7, -351.2, -349.1, -344.8, 
                                   -337.8, -329.1, -325, -317, -312.3, -303.3, -301.2, -294.8, -291.5, 
                                   -283.9, -280.4, -272.5, -269.3, -261.6, -258.7, -253.6, -249.2, 
                                   -243, -239.9, -235.1, -229.4, -223.7, -220.8, -219.7, -212.8, 
                                   -208.7, -207.1, -210.2, -201.2, -198.2, -192.1, -190.7, -183.6, 
                                   -181.2, -173.4, -167, -162.5, -156.6, -152.7, -148.7, -144.3, 
                                   -140.6, -136.5, -133.5, -131.4, -132.1, -125.4, -120.2, -117.1, 
                                   -114.1, -111, -110.7, -103.6, -98.7, -95.9, -93.7, -92.7, -94.6, 
                                   -87.4, -83.2, -79.5, -76, -75.8, -72.8, -72.5, -67.7, -67.7, 
                                   -62.9, -65.2, -64.9, -60.7, -57, -51.9, -47.6, -45.7, -43.8, 
                                   -44.1, -46.3, -41.5, -36.8, -34.9, -30.3, -28.8, -25.8, -26.4, 
                                   -24.1, -26.4, -28, -23.1, -18.4, -16, -12, -10.4, -8.6, -7.1, 
                                   -6.5, -4, -2.9, -1.1, -0.7, 1.8, 4, 2.9, 4.1, 2.1, 1.7, 5.7, 
                                   8.8, 11.2, 13.5, 16, 17.8, 20.3, 20.9, 18.9, 11.6, 16.7, 16.3, 
                                   20.7, 20.9, 27.4, 33.6, 33.4, 39, 36.4, 41.8, 31.6, 18.5, 36.6, 
                                   46.5, 47.3, 46.3, 47.2, 48.1, 49.4, 50.8, 53.9, 56.6, 57.4, 59.1, 
                                   51.8, 42.1, 52.6, 61.5, 61.8, 63.1, 52.3, 43.6, 53.5, 65.7, 65.9, 
                                   66.2, 66.3, 66.8, 65.2, 62.5, 66.1, 68.2, 57, 35.9, 50.9, 49.9, 
                                   61.2, 66, 67.4, 67.4, 58.8, 40.3, 47.3, 39.8, 57.9, 70.7, 71.3, 
                                   71.7, 72.2, 72.4, 69.3, 63, 69.7, 73.2, 73.5, 73.6, 65.2, 53.4, 
                                   58.6, 54.3, 60.5, 54.6, 67.3, 74, 73.8, 73.2, 71.6, 67.7, 72, 
                                   74.3, 69.8, 74.4, 69.9, 74.5, 74.2, 74.5, 70.8, 74.5, 71, 74.4, 
                                   71.1, 65, 70.8, 73.8, 73.3, 72.3, 61.7, 44.2, 54.3, 51.2, 61.1, 
                                   70.7, 67, 68.4, 66.9, 70.7, 68.5, 72.9, 73, 72.9, 72.4, 72.5, 
                                   72.3, 72.8, 68.5, 72.6, 68, 71.6, 64.1, 55.7, 63.6, 71.4, 71.7, 
                                   72.5, 71.9, 70.9, 71.4, 72.4, 65.8, 54.8, 61.9, 59.9, 67.5, 71.4, 
                                   66.8, 60.2, 66.6, 71.2, 70.9, 70.6, 70.4, 70.2, 63.4, 50.7, 62.8, 
                                   69.1, 68.7, 68.3, 68.1, 68.1, 67.5, 67.2, 60.5, 52.3, 58.3, 67.3
                     )))

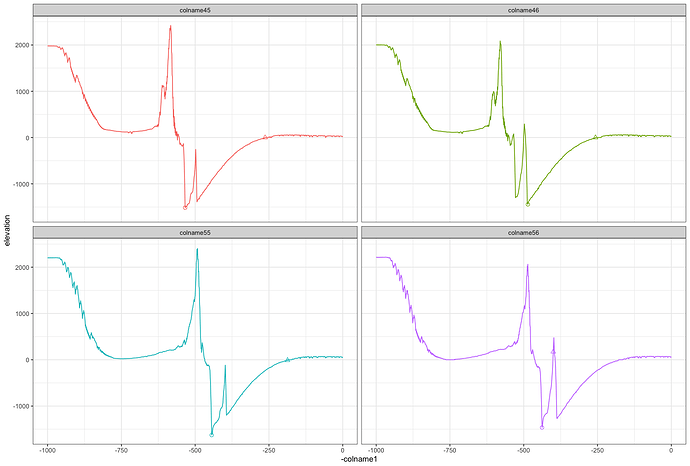
Essentially, my goal is that when second mountain (the peak in trough, ~ at 450-300 in plot 55 & 56 and ~550 - 400 in plots 45 & 46 on the Y-axis)grows above sea-level, the point of interest indicated by the circle will shift to the right of the second mountain. The point of interest indicated by the triangle will stay in the same place. This happens from plot 45 - 46.

In plots 55 - 56 the point of interest marked by the triangle jumps and the circle does not. In cases like 45, 46 and all others aside from 55 - 56, the min() logic was all that was needed to move the circle from one side of the mountain to the other. I believe the way you had the placement of Y_sea_level chosen depends upon the placement of Y_lowest_point, correct?
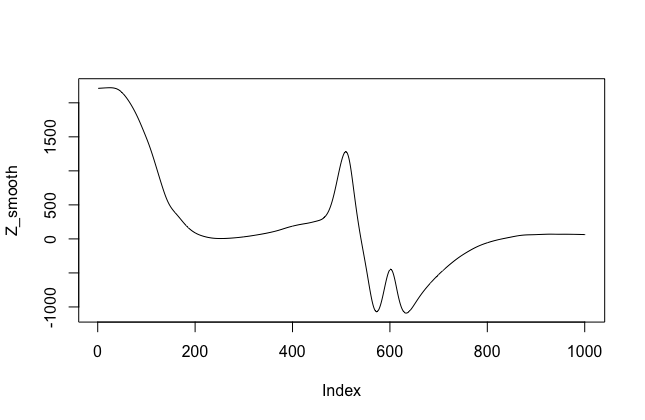
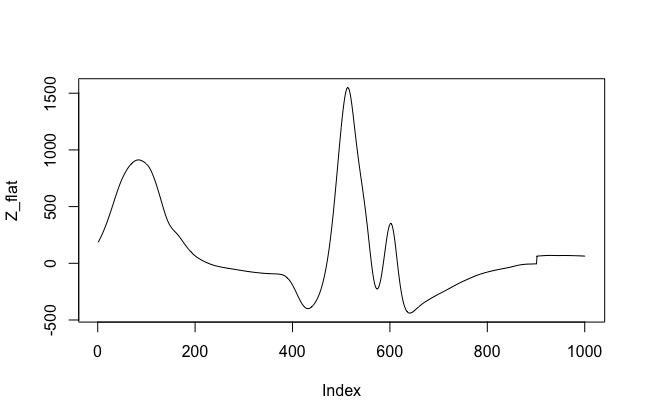
The goal is to make a function that takes in the Z values and returns the points of interest. Then you can simply call that function in the summarize() statement. Here are a few things to start with, but that would require optimization:


Z <- transect$Z_56

plot(Z) # visualize raw Z

# Smooth to detect true peaks rather than small variations
Z_smooth <- smooth.spline(Z,spar = .5)$y

plot(Z_smooth, type = 'l') #visualize smoothing

# Subtract the mean to center on zero
k_mean <- k_mean
Z_flat <- Z_smooth - zoo::rollmean(Z_smooth,
                                   k = k_mean,
                                   fill=0,
                                   align="left")
plot(Z_flat, type = "l")

# Now we can just detect the peaks
peaks_high <- which(peakPick::peakpick(Z_flat,
                               neighlim = 20,
                               deriv.lim = 100,
                               peak.min.sd = 5))
# filter out the peaks that are at the very beginning or end
peaks_high <- peaks_high[peaks_high > 200 & peaks_high < 800]

# Depending on the number of peaks detected, extract the information of interest

if(length(peaks_high) == 0){
  warning("Too many peaks")
  mountain <- NA
  valley <- NA
} else if(length(peaks_high) == 1){
  mountain <- peaks_high
  valley <- peaks_high + which.min(Z[peaks_high:length(Z)])
} else if(length(peaks_high) == 2){
  # second mountain
  mountain <- peaks_high[2]
  #second valley
  valley <- peaks_high[2]+which.min(Z[peaks_high[2]:length(Z)])
} else{
  warning("Too many peaks")
  mountain <- NA
  valley <- NA
}

# if in a function, use a named vector as return value
c("mountain" = mountain, "valley" = valley)

Thank you @AlexisW! All of this looks real slick. The smooth.spline() is extremely helpful and the peakpick package is awesome to know about too! I had thought about using the peaks to restrict the window but I couldn't get past the inconsequential noise in the data! In the past I used something like this to find peaks.

which(diff(sign(diff(abs(df$blue$Y))))==-2)+1

I think I am following everything you suggested, except for the

k_mean <- k_mean

part. Could you break that down a bit more explicitly for me?

Oh it's a typo, because I had written something different at first, then modified it. Should be:

Z_flat <- Z_smooth - zoo::rollmean(Z_smooth,
                                   k = 101,
                                   fill=0,
                                   align="left")

At first I didn't know about the fill argument of rollmean() so I was filling in 0s manually and needed to know the value of k.

Okay, so with this, I can restrict the process from before to only consider values on the right side of the "mountain" value if the Z value at mountain >= 0 that should solve all of my issues. Thank you so much!

I have one final question. I am failing to see the purpose of the z_flat purpose. If I did it right, we went from
z_smooth

to

z_flat

When running the peaksPick lines on either Z_smooth or Z_flat, the returned values are the same. Is this just a matter of making the code robust?

I think it was with the idea of making the peak.min.sd criterion stronger. But it's not well-tested code, I rather followed a few ideas I had and chose parameters to make it work, I don't guarantee the robustness. The mean subtraction may or may not be useful.

Also, I hoped a bit to remove the initial plateau, but that didn't work. It would probably work better with a rolling ball background subtraction (e.g. this R package), or perhaps zoo::rollmedian().

@AlexisW, I am trying to apply what you have suggested and I have ran into a few other minor issues. I would like to take the long_data.frame, group by timestep, apply the smooth.spline, locate the mountain and valley (as you have already helped me do), then find the two points of interest to measure width by taking the difference.

I have tried

#did not work
long_transect %>% group_by(timestep) %>% smooth.spline(, spar = .5)

I am not sure if I need to summarize before I pipe to smooth.spline or if I am using spline wrong altogether. Have any input on the matter?

There are two separate aspects in your problem. The first one is the manipulation of the entire data frame to apply transformations to it. For this, the tidyverse approach is the best. The second is more of a signal processing aspect, that works on a vector of Z values and detects the points of interests. I recommend that you keep them separate, as it makes things easier to think about.

So, the data frame manipulation can use group_by(), summarize() and mutate() (plus a few other for formatting). mutate() takes a vector for each group, applies a function, and gets a new column (so the number of elements stays the same). summarize() takes a vector for each group, and applies a function that gives only a few values. So the result is a smaller data frame, with one value per group.

The signal processing part should then be inside functions that are called by mutate() and summarize(). For example:

find_point_of_interest <- function(Z){
  #do signal processing computations
  return(point_of_interest)
}

long_data %>%
  group_by(timestep) %>%
  summarize(poi = find_point_of_interest(Z))

Now that we have the data frame processing aspect, the only question becomes what signal processing to put in the function. I previously offered one:

find_point_of_interest <- function(Z){
  Z_smooth <- smooth.spline(Z,spar = .5)$y
  Z_flat <- Z_smooth - zoo::rollmean(Z_smooth,
                                   k = k_mean,
                                   fill=0,
                                   align="left")
  peaks_high <- which(peakPick::peakpick(Z_flat,
                               neighlim = 20,
                               deriv.lim = 100,
                               peak.min.sd = 5))
  peaks_high <- peaks_high[peaks_high > 200 & peaks_high < 800]

  if(length(peaks_high) == 0){
    warning("Too many peaks")
    mountain <- NA
    valley <- NA
  } else if(length(peaks_high) == 1){
    mountain <- peaks_high
    valley <- peaks_high + which.min(Z[peaks_high:length(Z)])
  } else if(length(peaks_high) == 2){
    # second mountain
    mountain <- peaks_high[2]
    #second valley
    valley <- peaks_high[2]+which.min(Z[peaks_high[2]:length(Z)])
  } else{
    warning("Too many peaks")
    mountain <- NA
    valley <- NA
  }
  return(mountain)
}

That one may or may not be satisfying, but can be used as a basis for more optimized things.

In your question, the pipe %>% is taking a data frame from the left, and feeding it into smooth.spline() which is expecting a vector or a two-column matrix. So I recommend that you don't put smooth.spline() directly in pipe, but that you always call it via the "adapters" mutate() or summarize(). So your question might be answered with something like (code not tested):


find_poi <- function(Z_flat){
peaks_high <- which(peakPick::peakpick(Z_flat,
                               neighlim = 20,
                               deriv.lim = 100,
                               peak.min.sd = 5))
  peaks_high <- peaks_high[peaks_high > 200 & peaks_high < 800]

  if(length(peaks_high) == 0){
    warning("Too many peaks")
    mountain <- NA
    valley <- NA
  } else if(length(peaks_high) == 1){
    mountain <- peaks_high
    valley <- peaks_high + which.min(Z[peaks_high:length(Z)])
  } else if(length(peaks_high) == 2){
    # second mountain
    mountain <- peaks_high[2]
    #second valley
    valley <- peaks_high[2]+which.min(Z[peaks_high[2]:length(Z)])
  } else{
    warning("Too many peaks")
    mountain <- NA
    valley <- NA
  }
  return(c("mountain" = mountain, "valley" = valley))
}

poi <- long_data %>%
  group_by(timestep) %>%
  mutate(Z_smoothed = smooth.splines(Z, spar=.5)) %>%
  summarize(points = find_poi(Z)) %>%
  mutate(mountain = poi$mountain,
         valley = poi$valley)

#for diagnostics
dir_path <- "mydir/diagnostics_plots"
for(cur_time in poi$timestep){
  cur_Z <- data_long %>%
    filter(timestep == cur_time) %>%
    pull(Z_smooth)
  cur_mountain <- poi[timestep == cur_time, "mountain"]
  cur_valley <- poi[timestep == cur_time, "valley"]

  png(paste0(dir_path, "_", cur_time))
    plot(cur_Z)
    points(cur_mountain, cur_Z[cur_mountain], col='red')
    points(cur_valley, cur_Z[cur_valley], col='green')
  dev.off()
}

poi %>%
  mutate(difference = cur_valley - cur_mountain)
1 Like

This topic was automatically closed 7 days after the last reply. New replies are no longer allowed.

If you have a query related to it or one of the replies, start a new topic and refer back with a link.