Hello,
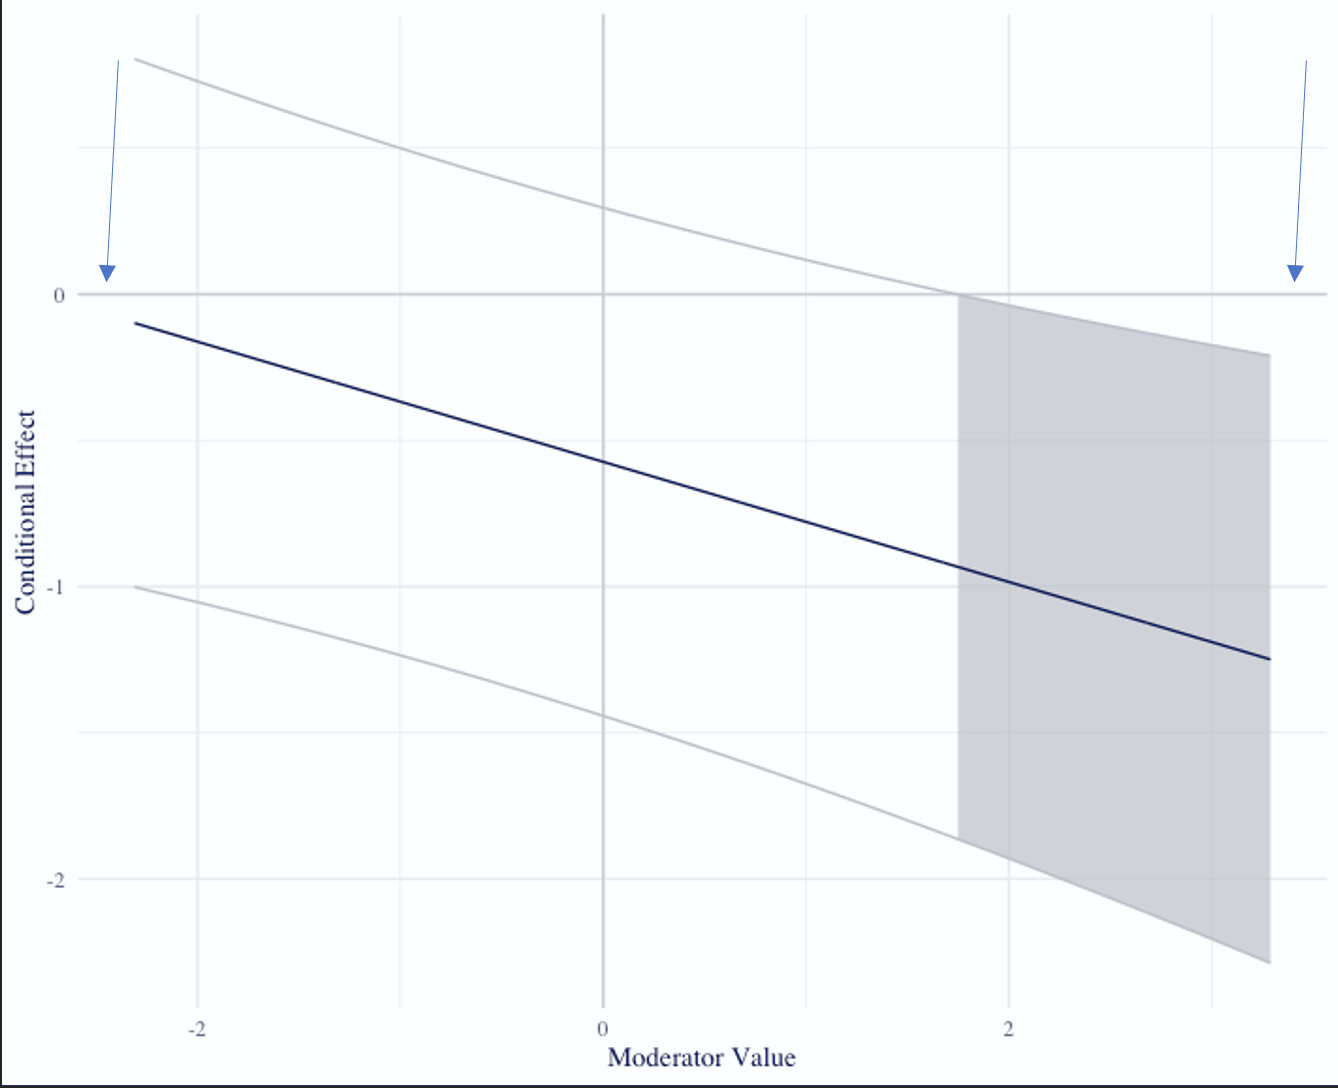
I'm trying to restrict my x axis to cut off points so the graph ends where the region of significance ends (see blue arrows in screenshot). I'm using a ggplot. What syntax could I add to restrict the x axis to these points. Thanks.
Hello,
I'm trying to restrict my x axis to cut off points so the graph ends where the region of significance ends (see blue arrows in screenshot). I'm using a ggplot. What syntax could I add to restrict the x axis to these points. Thanks.
Could you please refer to FAQ: How to do a minimal reproducible example ( reprex ) for beginners
My code involves transporting data from MPlus to R and then plotting. I don't see how I could do this with a minimal reproducible example.
Follow these links and you will be able to post a reproducible example.
Also here https://reprex.tidyverse.org/
ggplot2 has good documentation here if you haven't seen it:
You could control the range of plotting to end exactly at the edge of your plotted data either using scale_x_continuous(expand = expansion(mult = 0)) or coord_cartesian(expand = FALSE). I think in the latter case it would also eliminate any padding on the y axis, which might not be what you want.
interesting I'll try this
This topic was automatically closed 21 days after the last reply. New replies are no longer allowed.
If you have a query related to it or one of the replies, start a new topic and refer back with a link.