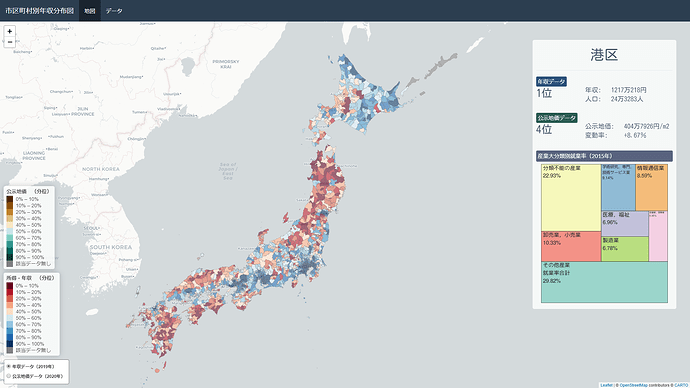
Update:
I believe it's an issue with Unicode letters inside the render as after messing around, now the treemap is displayed but the text has "glyph missing" symbols.
Hi!
I'm making an interactive map of Japanese income data, and have a side panel displaying a treemap with the distribution of workers across sectors for a selected municipality.
This works locally, but does not render when I upload it to shinyapps.io giving the following error: ERROR: An error has occured. Check your logs or contact the app author for clarification.
However, no logs are present on my dashboard for this app.
Here's a link to the app:
https://andreasandersen.shinyapps.io/Japan_Income/
I can add the whole code, but I'll first paste the parts I think are relevant:
Packages loaded:
library(tidyverse)
library(treemap)
library(rgeos)
library(sf)
library(shiny)
library(shinythemes)
library(leaflet)
library(DT)
library(scales)
library(htmltools)
The function drawing the treemap given a data frame and the number of sectors to display in the treemap. (get_sector_names() is just a function converting the sector names to Japanese label values)
draw_treemap <- function(x, n) {
  temp_labourforce <- x %>% select(LabourForce) %>% pull()

  temp <- x %>%
    select(Agriculture:Others) %>%
    gather(key = "Sector", value = "Employees", Agriculture:Others) %>%
    mutate(Sector = get_sector_names(Sector)) %>%
    arrange(desc(Employees))

  temp_others <- sum(temp$Employees[(n+1):nrow(temp)])

  temp_final <- temp %>%
    head(n) %>%
    rbind(data.frame(Sector = "その他産業\n就業率合計", Employees = temp_others)) %>%
    mutate(Order = 1:(n+1)) %>%
    mutate(Sector = paste(Sector, as.character(scales::percent(Employees / temp_labourforce , accuracy = 0.01)), sep = "\n"))

  return(treemap(temp_final, index = "Sector", vSize = "Employees", palette = "Set3", sortID = "Order", algorithm = "pivotSize",
          align.labels = c("left", "top"), fontface.labels = "plain", fontsize.labels = 15, border.lwds = 1, title = ""))
}
Reactive filtering function based on where the map is clicked
municipality_data <- reactive(if(is.null(input$map_shape_click) == TRUE) {
    df %>% filter(Municipality == "港区") %>% st_set_geometry(NULL)
  } else {
    if(is.character(input$map_shape_click$id) == TRUE) {
        df %>% filter(Code == input$map_shape_click$id) %>% st_set_geometry(NULL)
    } else {
        df %>% filter(Population == input$map_shape_click$id) %>% st_set_geometry(NULL)
      }
  })
renderPlot with the call to the previous function
output$industrytreemap_plot <- renderPlot({
    draw_treemap(municipality_data(), 7)
  })
Just to clarify, all this works locally.
I'd appreciate any and all ideas or suggestions on this.
