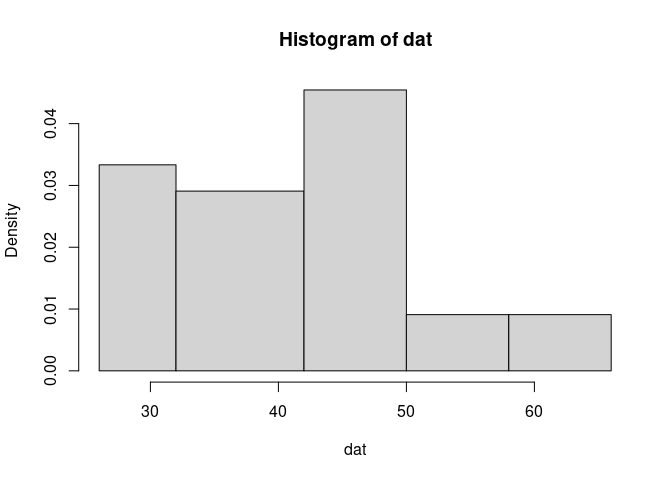
Hello,
I have a dataset named mydata about the age of customers.
28
50
37
51
42
27
40
38
46
48
56
29
44
40
42
46
50
30
60
30
43
66
32
36
35
48
47
43
39
26
44
32
35
47
42
47
34
39
34
60
43
26
50
43
61
42
32
45
46
49
54
51
39
26
49
I have been struggling to find a way to create bins with corresponding text. Here is the code I came up with (I am sure there is a better and shortest way):
min = min(mydata)
min
max= max(mydata)
max
(max-min)/6 # rule to create bins
sum1 = sum(mydata$ages < 34)
sum2= sum(mydata$ages >= 34 & mydata$ages < 42)
sum3= sum(mydata$ages >= 42 & mydata$ages < 50)
sum4 = sum(mydata$ages >= 50 & mydata$ages <58)
sum5 = sum(mydata$ages >= 58 & mydata$ages < 66)
sum6= sum(mydata$ages >= 66 & mydata$ages < 73)
sum = c(somme1, somme2, somme3, somme4, somme5, somme6)
classes = c("26-33", "34-41", "42-49", "50-57", "58-65", "66-73" )
mytable = data.frame(classes, sum)
The issue is how to get R to display a histogram that has bins (classes) and the count (sums) on the y-axis, if possible with ggplot2.
It keeps giving me this error : Error: stat_bin() can only have an x or y aesthetic.
Is there a better way to create bins and how to display a histogram with no gaps and text on the x-axis?