Hi Users,
I'm trying to plot a map (done) then create a 'shiny' app with dropdowns for age selection of some census data with the 'tmap' package. I can run the code up to line 19 all Okay (console code below) i get the plot (done).
When i introduce 'ui <- fluidPage' it places the widget as I want it. The problem for me is the server logic which I am stuck on 'server <- function(input, output)'
I am trying to copy the example below:-
censusVis
Can someone check the 'console' and 'server' code below for any obvious errors:-
------------------------------------------------------------------------------------------------------------
Console Session
---------------------------------------------------------------------------------------------------------------
Restarting R session...
>
> library(shiny); runApp('C:/Users/Administrator.????/Desktop/R_Projects/shiny/merge.R')
Error in install.packages : Updating loaded packages
WARNING: Rtools is required to build R packages but is not currently installed. Please download and install the appropriate version of Rtools before proceeding:
https://cran.rstudio.com/bin/windows/Rtools/
trying URL 'https://cran.rstudio.com/bin/windows/contrib/3.4/tmap_2.2.zip'
Content type 'application/zip' length 2898245 bytes (2.8 MB)
downloaded 2.8 MB
package ‘tmap’ successfully unpacked and MD5 sums checked
The downloaded binary packages are in
D:\Rtmps7Shgk\downloaded_packages
WARNING: Rtools is required to build R packages but is not currently installed. Please download and install the appropriate version of Rtools before proceeding:
https://cran.rstudio.com/bin/windows/Rtools/
trying URL 'https://cran.rstudio.com/bin/windows/contrib/3.4/tmaptools_2.0-1.zip'
Content type 'application/zip' length 197621 bytes (192 KB)
downloaded 192 KB
package ‘tmaptools’ successfully unpacked and MD5 sums checked
The downloaded binary packages are in
D:\Rtmps7Shgk\downloaded_packages
WARNING: Rtools is required to build R packages but is not currently installed. Please download and install the appropriate version of Rtools before proceeding:
https://cran.rstudio.com/bin/windows/Rtools/
There is a binary version available but the source version is later:
binary source needs_compilation
sf 0.7-4 0.7-6 TRUE
Binaries will be installed
trying URL 'https://cran.rstudio.com/bin/windows/contrib/3.4/sf_0.7-4.zip'
Content type 'application/zip' length 38927402 bytes (37.1 MB)
downloaded 37.1 MB
package ‘sf’ successfully unpacked and MD5 sums checked
The downloaded binary packages are in
D:\Rtmps7Shgk\downloaded_packages
Linking to GEOS 3.6.1, GDAL 2.2.3, PROJ 4.9.3
Reading layer `lsoa_population' from data source `C:\Users\Administrator.????\Desktop\R_Projects\LSOA_SAPE\lsoa_population.shp' using driver `ESRI Shapefile'
Simple feature collection with 69 features and 11 fields
geometry type: MULTIPOLYGON
dimension: XY
bbox: xmin: 260195.4 ymin: 199776.3 xmax: 344447.7 ymax: 252058
epsg (SRID): NA
proj4string: +proj=tmerc +lat_0=49 +lon_0=-2 +k=0.9996012717 +x_0=400000 +y_0=-100000 +datum=OSGB36 +units=m +no_defs
Reading layer `bbnp_boundary' from data source `C:\Users\Administrator.????\Desktop\R_Projects\LSOA_SAPE\bbnp_boundary.shp' using driver `ESRI Shapefile'
Simple feature collection with 1 feature and 7 fields
geometry type: POLYGON
dimension: XY
bbox: xmin: 263134.3 ymin: 200862.2 xmax: 334533.2 ymax: 242815
epsg (SRID): NA
proj4string: +proj=tmerc +lat_0=49 +lon_0=-2 +k=0.9996012717 +x_0=400000 +y_0=-100000 +datum=OSGB36 +units=m +no_defs
Listening on http://127.0.0.1:5367
tmap mode set to plotting
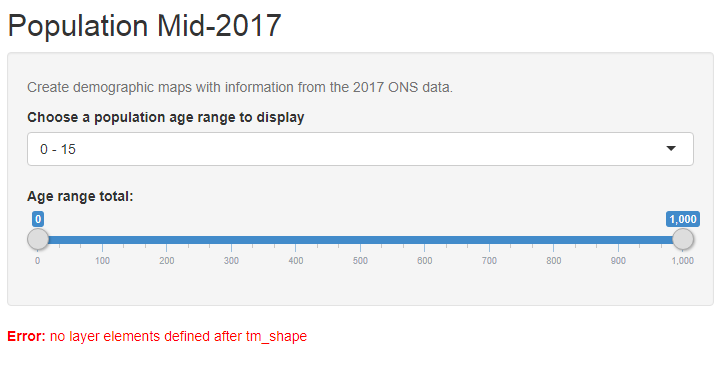
Warning: Error in : no layer elements defined after tm_shape
179: stop
178: <Anonymous>
177: mapply
176: prearrange_element_order
175: print_tmap
174: print.tmap
166: func
164: f
163: Reduce
154: do
153: hybrid_chain
125: drawPlot
111: <reactive:plotObj>
95: drawReactive
82: origRenderFunc
81: output$tm_shape
1: runApp
-------------------------------------------------------------------------------------------------------------------------
R Code:-
------------------------------------------------------------------------------------
install.packages("shiny")
install.packages("tmap")
install.packages("tmaptools")
install.packages("sf")
library(shiny)
library(tmap)
library(tmaptools)
library(sf)
#Set working directory ----
setwd("C:/Users/Administrator.????/Desktop/R_Projects/LSOA_SAPE")
getwd()
#Read shapefiles ----
s.sf <- st_read("lsoa_population.shp")
boundary.sf <- st_read("bbnp_boundary.shp")
#Read attributes ----
head(s.sf, n = 69)
#Select render mode either 'plot' or 'view' (leaflet map background)
#tmap_mode("plot")
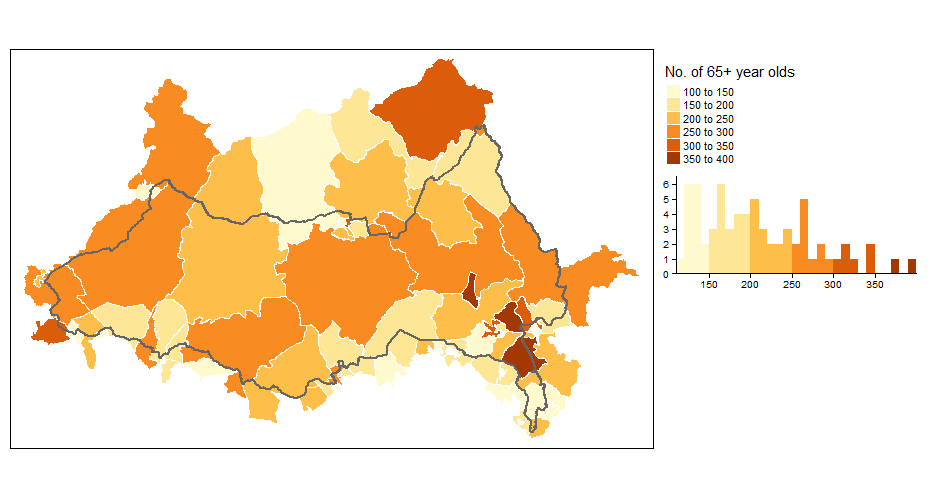
#tm_shape(s.sf) + tm_polygons(col = "X65.", border.col = "white", legend.hist = TRUE, title = "No. of 65+ year olds") + tm_legend(outside = TRUE, hist.width = 2) + tm_shape(boundary.sf) + tm_borders(lwd = 2.0) + tm_fill(alpha = 0)
# User interface ----
ui <- fluidPage(
titlePanel("Population Mid-2017"),
sidebarLayout(
sidebarPanel(
helpText("Create demographic maps with
information from the 2017 ONS data."),
selectInput("var",
label = "Choose a population age range to display",
choices = c("0 - 15", "16 - 29",
"30 - 44", "45 - 64", "65 +"),
selected = "0 - 15"),
sliderInput("age",
label = "Age range total:",
min = 0, max = 1000, value = c(0, 1000))
),
mainPanel(plotOutput("tm_shape"))
)
)
# Server logic ----
server <- function(input, output) {
output$tm_shape <- renderPlot({
tmap_mode("plot")
tm_shape(s.sf) + tm_polygons(col = "X65.", border.col = "white", legend.hist = TRUE, title = "No. of 65+ year olds") + tm_legend(outside = TRUE, hist.width = 2) + tm_shape(boundary.sf) + tm_borders(lwd = 1.7) + tm_fill(alpha = 0)
s.sf <- switch(input$var,
"0-15" = tm_shape$X0.15,
"16-29" = tm_shape$X16.29,
"30-44" = tm_shape$X30.44,
"45-64" = tm_shape$X45.64,
"65+" = tm_shape$X65.)
color <- switch(input$var,
"0-15" = "darkgreen",
"16-29" = "black",
"30-44" = "darkorange",
"45-64" = "darkviolet",
"65+" = "green")
legend <- switch(input$var,
"0-15" = "No.0-15",
"16-29" = "No.16-29",
"30-44" = "No.30-44",
"45-64" = "No.45-64",
"65+" = "No.65+")
tm_shape(s.sf, color, legend, input$range[1], input$range[2])
})
}
# Run app ----
shinyApp(ui, server)