Hi,
I am trying to plot the time series with the data
https://www.dropbox.com/s/gwbqghgk7w6g6iy/NCORE_GEOS_PM_01.csv?dl=0
for that I am trying
  NCORE_GEOS_PM_01 %>%
     ggplot(aes(x = date, y=value, colour=variable))  +
     geom_point(size=0.8, alpha=0.9) + scale_x_date(date_labels = "%Y")
I am getting this plot (plot_01)
But, I need a continuous plot. The data have only 06,07,08 months data from 2012 to 2019.
  NCORE_GEOS_PM_01 %>%
    mutate(date = as.character(date)) %>%
    ggplot(aes(x = date, y=value, colour=variable))  +
    geom_point(size=0.8, alpha=0.9)
from this, I am getting (plot_02)
In plot_2, I am not able to set the x-axis. I need to show only the years on the x-axis.
So, could you please let me know how to create a continuous time series without any gaps (with years on the x-axis).
FJCC
May 8, 2022, 3:28am
2
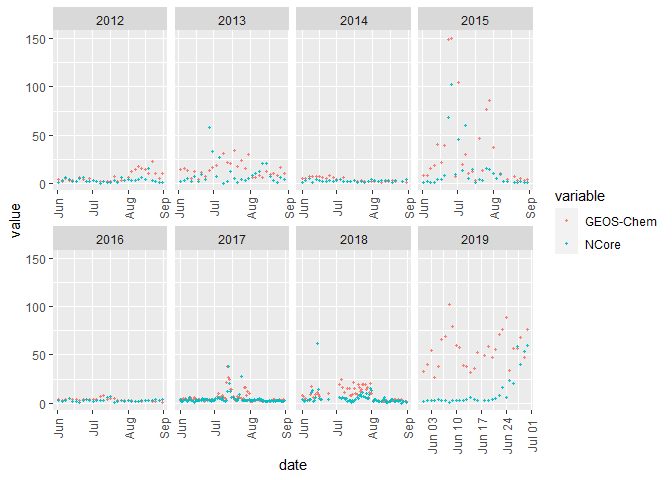
Rather than transforming the data to force a continuous plot, I suggest faceting by year.
library(tidyverse)
#> Warning: package 'tibble' was built under R version 4.1.2
library(lubridate)

NCORE_GEOS_PM_01 <- read.csv("~/R/Play/NCORE_GEOS_PM_01.csv")
colnames(NCORE_GEOS_PM_01)[1] <- "date"

NCORE_GEOS_PM_01 |>  mutate(date = as.Date(date),
                            Year= year(date)) |>
  ggplot(aes(x = date, y=value, colour=variable))  +
  geom_point(size=0.8, alpha=0.9) + #scale_x_date(date_labels = "%Y")+
facet_wrap(~Year,nrow = 2,scales = "free_x") +
  theme(axis.text.x = element_text(angle = 90, vjust =0.5, hjust = 0.5))
Created on 2022-05-07 by the reprex package (v2.0.1)
1 Like
FJCC:
facet_wrap(~Year,nrow = 2,scales = "free_x") +
  theme(axis.text.x = element_text(angle = 90, vjust =0.5, hjust = 0.5))
Yes, it looks better this way. Thanks!
system
May 29, 2022, 4:57am
4
This topic was automatically closed 21 days after the last reply. New replies are no longer allowed.