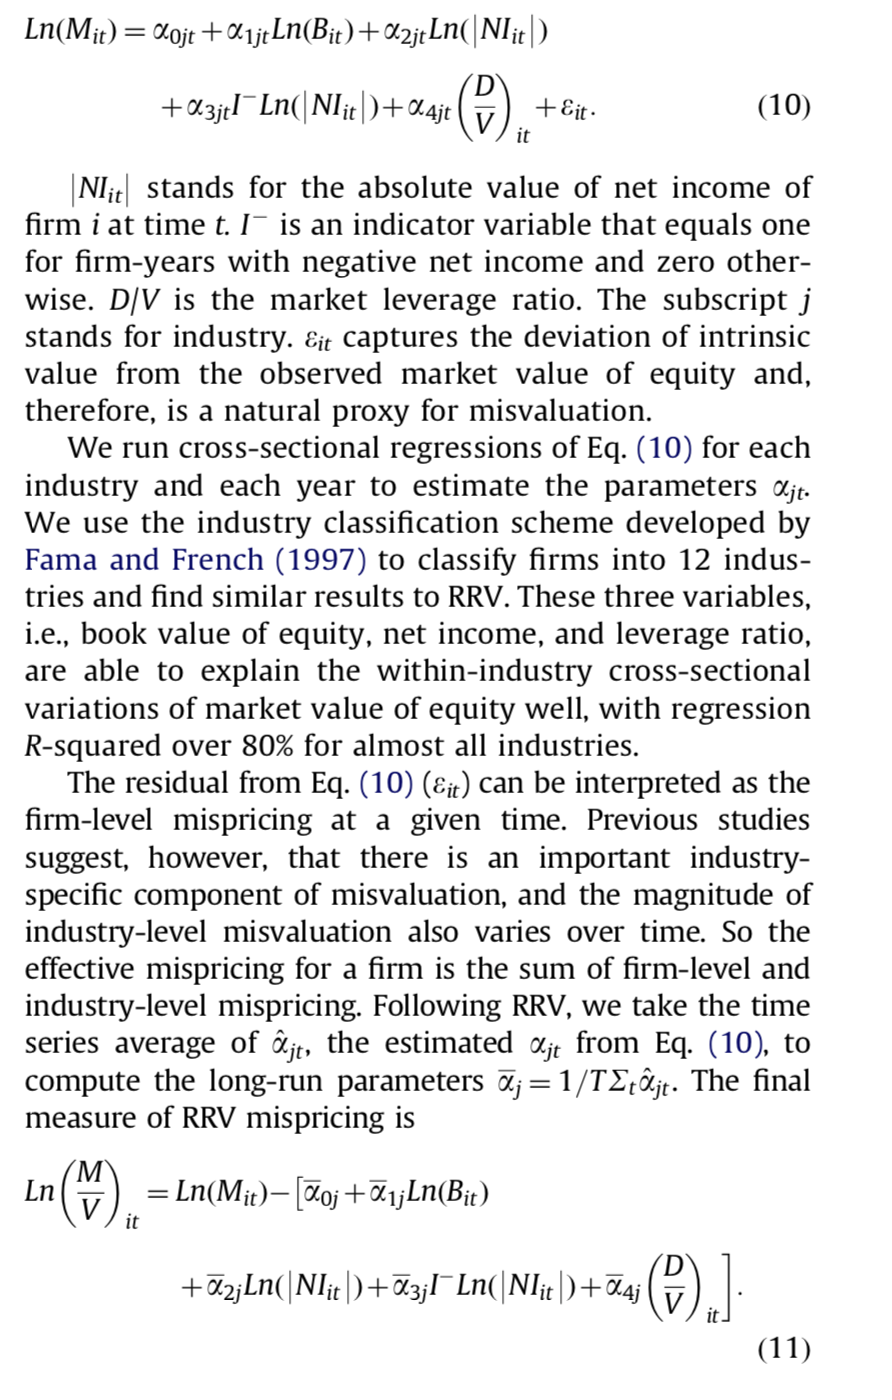
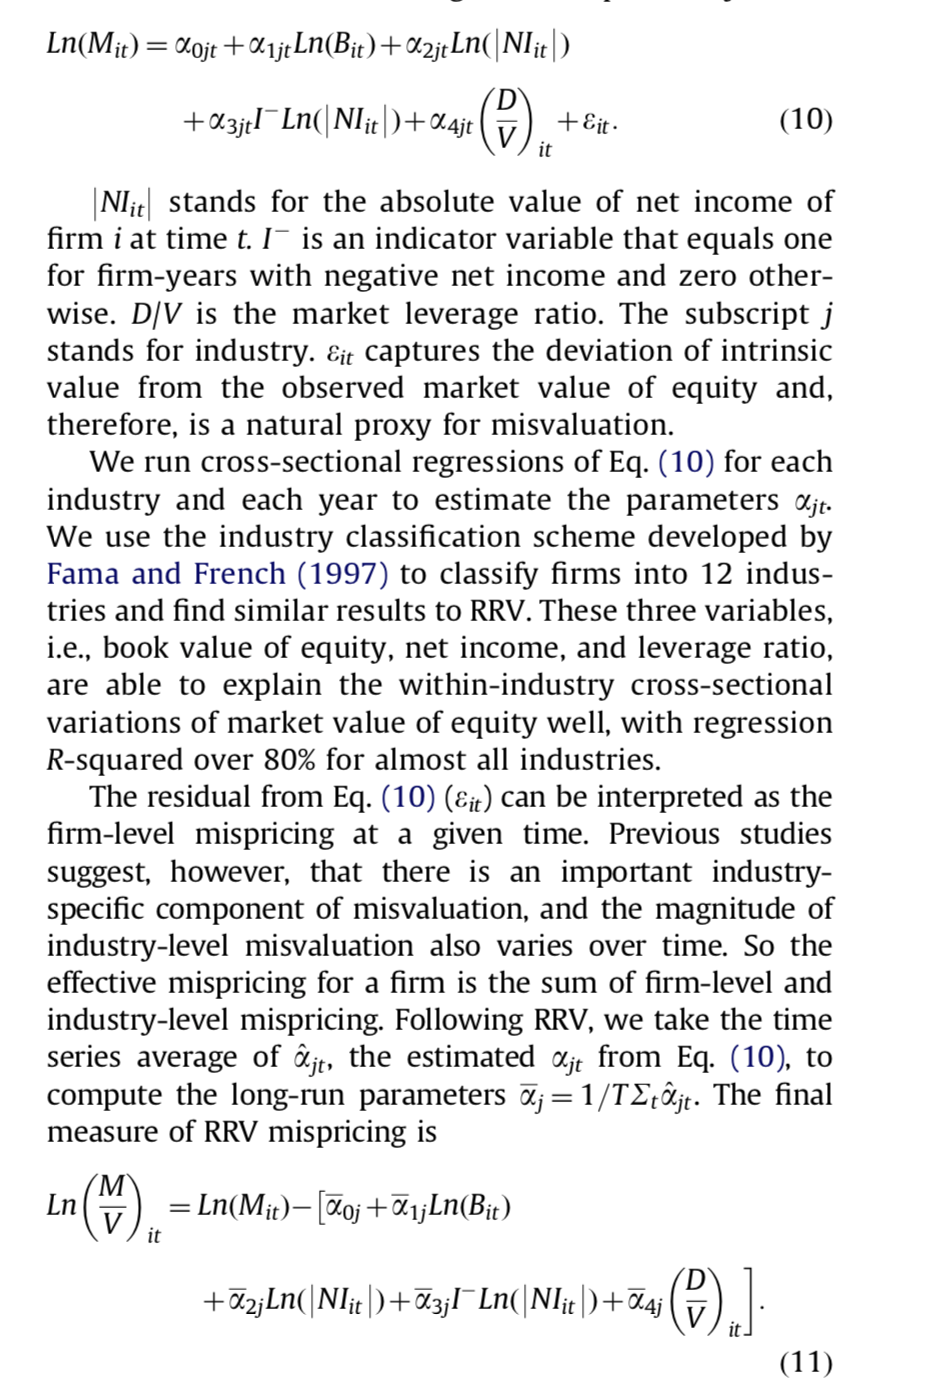
I have this kind of panel data, from which I should do following regression:

ind11_M <- lm(log(testdata$`- 42 days MV...5`) ~ log(testdata$`Book value of equity(thousands)`)
                                      + log(testdata$`Net Income (thousands)`)
                                      + (testdata$`Net Income factor`) * (log(testdata$`Net Income (thousands)`) )
                                         + (testdata$`Market leverage -42 days`))
#> Error in eval(predvars, data, env): object 'testdata' not found
I wasn't able to get the correct warning message here as it is "Warning message: NaNs produced
However, the mian probelm that I have is that how do this regression for each year (data from 1995-2019) for each industry ?
Created on 2020-10-27 by the reprex package (v0.3.0)
tibble::tribble(
  ~Year, ~X..42.days.MV...5, ~Book.value.of.equity.thousands., ~Net.Income..thousands., ~Market.leverage..42.days, ~Acquirer.Industry, ~Net.Income.factor,
  2019,             194670,                            45268,                   12523,                         0,       "Industry11",                  0,
  2019,             515040,                           364816,                   18846,         0.352571975206061,       "Industry12",                  0,
  2019,             816870,                           788000,                   74300,          0.60828534025137,       "Industry11",                  0,
  2019,           95654380,                         14561000,                   4e+06,         0.177169313339019,       "Industry12",                  0,
  2018,            1158580,                          6197000,                  104000,         0.907251124357367,       "Industry11",                  0,
  2018,          179889600,                         13980531,                 5770777,         0.326684463935401,       "Industry12",                  0,
  2018,             616920,                           495170,                   17287,          0.59175867625309,       "Industry11",                  0,
  2018,             124710,                           427600,                  -39800,                         0,       "Industry12",                  1,
  2018,             169620,                            88318,                   13120,         0.191319148124663,       "Industry12",                  0,
  2018,            2634050,                          3402000,                  153000,         0.754493641095903,       "Industry11",                  0
)
#> # A tibble: 10 x 7
#>     Year X..42.days.MV..… Book.value.of.e… Net.Income..tho… Market.leverage…
#>    <dbl>            <dbl>            <dbl>            <dbl>            <dbl>
#>  1  2019           194670            45268            12523            0
#>  2  2019           515040           364816            18846            0.353
#>  3  2019           816870           788000            74300            0.608
#>  4  2019         95654380         14561000          4000000            0.177
#>  5  2018          1158580          6197000           104000            0.907
#>  6  2018        179889600         13980531          5770777            0.327
#>  7  2018           616920           495170            17287            0.592
#>  8  2018           124710           427600           -39800            0
#>  9  2018           169620            88318            13120            0.191
#> 10  2018          2634050          3402000           153000            0.754
#> # … with 2 more variables: Acquirer.Industry <chr>, Net.Income.factor <dbl>
Created on 2020-10-27 by the reprex package (v0.3.0)