Hi,
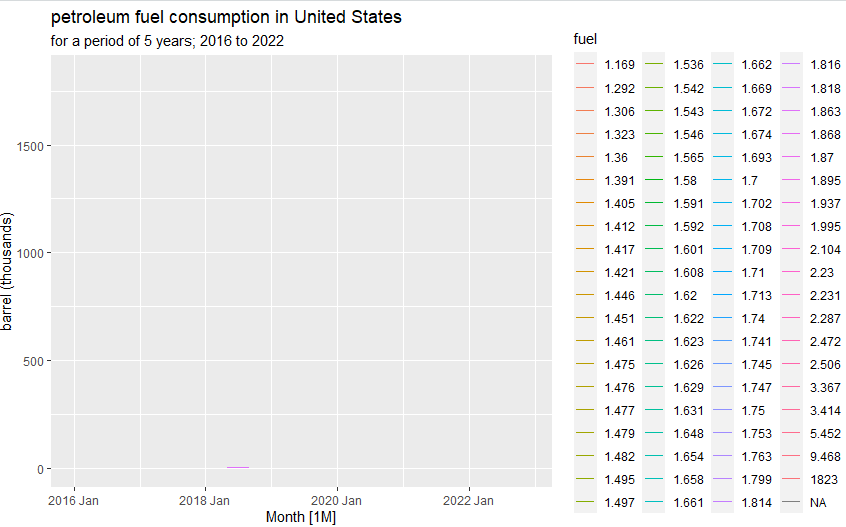
I was trying to plot monthly fuel consumption for last five years. I have converted the csv file into tissble using the below codes. But in-stead of generating any time-series plot (trend/seasonal); it just does not show anything. Can anyone kindly suggest, if it is a coding issue or data-structure issue?
install.packages("fpp3")
library(fpp3)
library(ggplot2)
library(readr)
library(tidyverse)
read the data frame
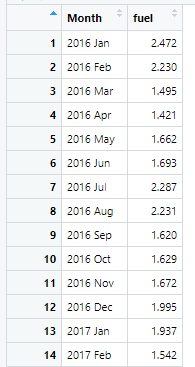
data = read.csv('data.csv')
view(data)
head(data)
convert the csv into tssible
data <- data %>%
mutate(Month = yearmonth(Date)) %>%
select(-Date) %>%
as_tsibble(key = c(fuel),
index = Month)
Rearrange the tssible with order of date.
data = data[order(data$Month),]
convert the fuel type to "dbl" from "chr"
library(dplyr)
library(readr)
new_data=data %>%
mutate(across(fuel, ~parse_number(., locale = locale(decimal_mark = ","))))%>%
relocate(fuel, .after = Month)
view(new_data)
new_data
Autoplot of the monthly fuel consumption each year from 2016 to 2022
consumption <- new_data %>%
mutate(fuel = fuel*1000)
autoplot(new_data, fuel) +
labs(title = "petroleum fuel consumption in United States",
subtitle = "for a period of 5 years; 2016 to 2022",
y = "barrel (thousands)")