Time Series analysis

dataset6 <- read.csv(file = "Recife.csv")
dataset6_as_time_series <- ts(data = dataset6, start = c(1953, 1), end = c(1961, 12), 
    frequency = 12)
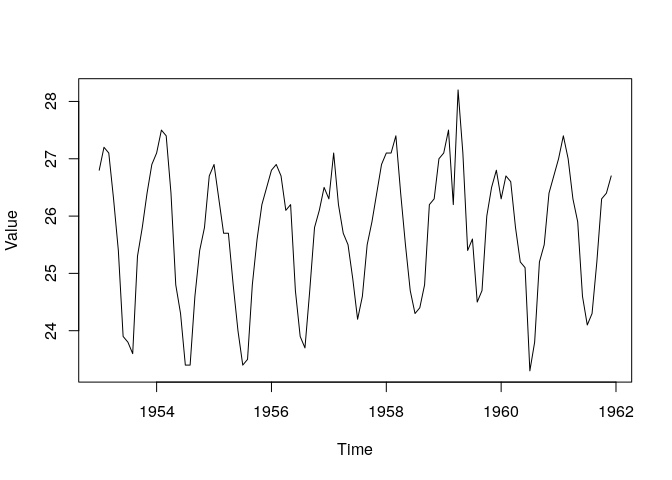
 plot(dataset6_as_time_series)

I find difficult to plot the time series of the data below. The codes above are my inputs and it gives me error.

  Jan  Feb  Mar  Apr  May  Jun  Jul  Aug  Sep  Oct  Nov  Dec

1953 26.8 27.2 27.1 26.3 25.4 23.9 23.8 23.6 25.3 25.8 26.4 26.9
1954 27.1 27.5 27.4 26.4 24.8 24.3 23.4 23.4 24.6 25.4 25.8 26.7
1955 26.9 26.3 25.7 25.7 24.8 24.0 23.4 23.5 24.8 25.6 26.2 26.5
1956 26.8 26.9 26.7 26.1 26.2 24.7 23.9 23.7 24.7 25.8 26.1 26.5
1957 26.3 27.1 26.2 25.7 25.5 24.9 24.2 24.6 25.5 25.9 26.4 26.9
1958 27.1 27.1 27.4 26.4 25.5 24.7 24.3 24.4 24.8 26.2 26.3 27.0
1959 27.1 27.5 26.2 28.2 27.1 25.4 25.6 24.5 24.7 26.0 26.5 26.8
1960 26.3 26.7 26.6 25.8 25.2 25.1 23.3 23.8 25.2 25.5 26.4 26.7
1961 27.0 27.4 27.0 26.3 25.9 24.6 24.1 24.3 25.2 26.3 26.4 26.7

I am guessing dataset6 has more than one column of data. Which one do you want to plot?

dataset6 has 12 columns (Jan - Dec) and 9 rows (1953 - 1961). So I want to plot ts of all the data.
Thanks

You need to reshape your data into a long format, also for future posts please share your data on a copy/paste friendly format, like in this example:

dataset6 <- data.frame(
        Year = c(1953L, 1954L, 1955L, 1956L, 1957L, 1958L, 1959L, 1960L, 1961L),
         Jan = c(26.8, 27.1, 26.9, 26.8, 26.3, 27.1, 27.1, 26.3, 27),
         Feb = c(27.2, 27.5, 26.3, 26.9, 27.1, 27.1, 27.5, 26.7, 27.4),
         Mar = c(27.1, 27.4, 25.7, 26.7, 26.2, 27.4, 26.2, 26.6, 27),
         Apr = c(26.3, 26.4, 25.7, 26.1, 25.7, 26.4, 28.2, 25.8, 26.3),
         May = c(25.4, 24.8, 24.8, 26.2, 25.5, 25.5, 27.1, 25.2, 25.9),
         Jun = c(23.9, 24.3, 24, 24.7, 24.9, 24.7, 25.4, 25.1, 24.6),
         Jul = c(23.8, 23.4, 23.4, 23.9, 24.2, 24.3, 25.6, 23.3, 24.1),
         Aug = c(23.6, 23.4, 23.5, 23.7, 24.6, 24.4, 24.5, 23.8, 24.3),
         Sep = c(25.3, 24.6, 24.8, 24.7, 25.5, 24.8, 24.7, 25.2, 25.2),
         Oct = c(25.8, 25.4, 25.6, 25.8, 25.9, 26.2, 26, 25.5, 26.3),
         Nov = c(26.4, 25.8, 26.2, 26.1, 26.4, 26.3, 26.5, 26.4, 26.4),
         Dec = c(26.9, 26.7, 26.5, 26.5, 26.9, 27, 26.8, 26.7, 26.7)
)

library(tidyverse)
library(lubridate)

dataset6 %>% 
    gather(Month, Value, -Year) %>%
    transmute(Month = ymd(paste(Year, Month, "01", sep = "-")),
              Value = Value) %>% 
    arrange(Month) %>%
    select(-Month) %>% 
    ts(start = c(1953, 1), end = c(1961, 12), 
       frequency = 12) %>% 
    plot()

This topic was automatically closed 21 days after the last reply. New replies are no longer allowed.