Hello,
I have a data set
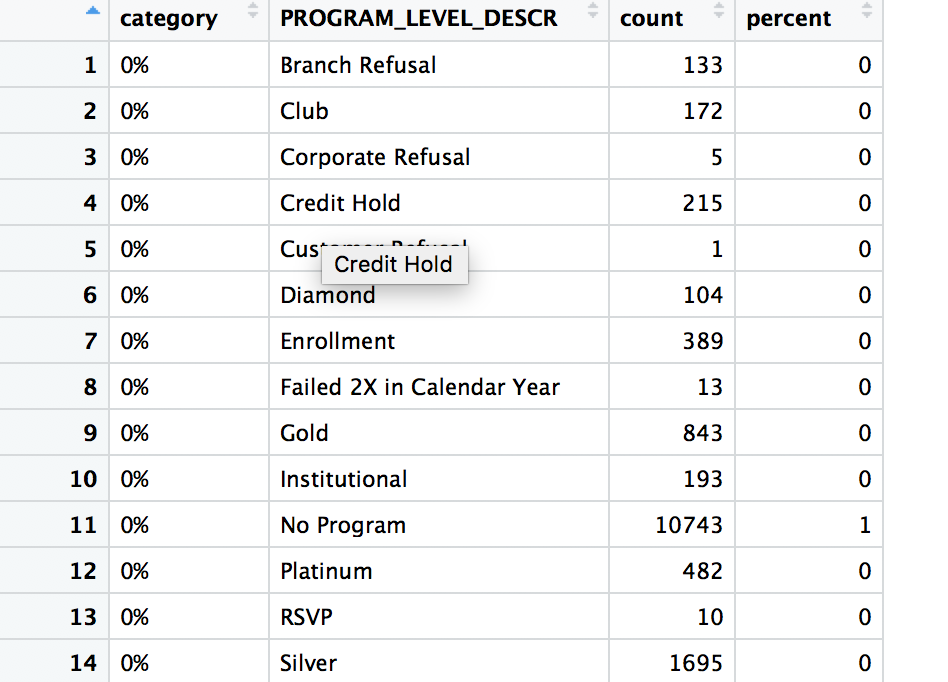
Summary
structure(list(PROGRAM_LEVEL_DESCR = structure(c(1L, 1L, 1L,
1L, 1L, 2L, 2L, 2L, 2L, 2L, 2L, 2L, 2L, 4L, 4L, 4L, 4L, 4L, 6L,
6L, 6L, 6L, 6L, 7L, 7L, 7L, 7L, 7L, 7L, 7L, 7L, 7L, 8L, 9L, 9L,
9L, 9L, 9L, 9L, 9L, 9L, 9L, 9L, 10L, 10L, 10L, 10L, 10L, 10L,
10L, 10L, 10L, 11L, 11L, 11L, 11L, 11L, 11L, 11L, 11L, 11L, 11L,
12L, 12L, 12L, 12L, 12L, 12L, 12L, 12L, 12L, 12L, 13L, 14L, 14L,
14L, 14L, 14L, 14L, 14L, 14L, 14L, 14L), .Label = c("Branch Refusal",
"Club", "Corporate Refusal", "Credit Hold", "Customer Refusal",
"Diamond", "Enrollment", "Failed 2X in Calendar Year", "Gold",
"Institutional", "No Program", "Platinum", "RSVP", "Silver"), class = "factor"),
    category = structure(c(1L, 2L, 3L, 5L, 7L, 1L, 2L, 3L, 4L,
    5L, 7L, 8L, 10L, 1L, 2L, 3L, 4L, 5L, 1L, 2L, 3L, 4L, 5L,
    1L, 2L, 3L, 4L, 5L, 7L, 8L, 9L, 10L, 3L, 1L, 2L, 3L, 4L,
    5L, 6L, 7L, 8L, 9L, 10L, 1L, 2L, 3L, 4L, 5L, 6L, 7L, 8L,
    10L, 1L, 2L, 3L, 4L, 5L, 6L, 7L, 8L, 9L, 10L, 1L, 2L, 3L,
    4L, 5L, 6L, 7L, 8L, 9L, 10L, 2L, 1L, 2L, 3L, 4L, 5L, 6L,
    7L, 8L, 9L, 10L), .Label = c("1", "2-4", "5-7", "8-10", "11-15",
    "16-20", "21-30", "31-40", "41-50", "> = 51"), class = "factor"),
    count = c(2L, 1L, 1L, 1L, 1L, 3L, 5L, 3L, 1L, 4L, 1L, 1L,
    1L, 12L, 14L, 6L, 1L, 2L, 4L, 5L, 5L, 2L, 1L, 14L, 22L, 7L,
    8L, 5L, 3L, 1L, 1L, 4L, 1L, 16L, 18L, 12L, 9L, 11L, 3L, 6L,
    3L, 1L, 3L, 10L, 21L, 9L, 3L, 5L, 2L, 2L, 2L, 1L, 779L, 918L,
    294L, 140L, 104L, 60L, 56L, 21L, 14L, 45L, 12L, 17L, 8L,
    3L, 3L, 4L, 4L, 2L, 2L, 3L, 1L, 20L, 55L, 26L, 16L, 27L,
    11L, 20L, 3L, 4L, 9L), percent = c("33.3%", "16.7%", "16.7%",
    "16.7%", "16.7%", "15.8%", "26.3%", "15.8%", "5.3%", "21.1%",
    "5.3%", "5.3%", "5.3%", "34.3%", "40%", "17.1%", "2.9%",
    "5.7%", "23.5%", "29.4%", "29.4%", "11.8%", "5.9%", "21.5%",
    "33.8%", "10.8%", "12.3%", "7.7%", "4.6%", "1.5%", "1.5%",
    "6.2%", "100%", "19.5%", "22%", "14.6%", "11%", "13.4%",
    "3.7%", "7.3%", "3.7%", "1.2%", "3.7%", "18.2%", "38.2%",
    "16.4%", "5.5%", "9.1%", "3.6%", "3.6%", "3.6%", "1.8%",
    "32%", "37.8%", "12.1%", "5.8%", "4.3%", "2.5%", "2.3%",
    "0.9%", "0.6%", "1.9%", "20.7%", "29.3%", "13.8%", "5.2%",
    "5.2%", "6.9%", "6.9%", "3.4%", "3.4%", "5.2%", "100%", "10.5%",
    "28.8%", "13.6%", "8.4%", "14.1%", "5.8%", "10.5%", "1.6%",
    "2.1%", "4.7%")), class = c("grouped_df", "tbl_df", "tbl",
"data.frame"), row.names = c(NA, -83L), vars = "PROGRAM_LEVEL_DESCR", labels = structure(list(
    PROGRAM_LEVEL_DESCR = structure(c(1L, 2L, 4L, 6L, 7L, 8L,
    9L, 10L, 11L, 12L, 13L, 14L), .Label = c("Branch Refusal",
    "Club", "Corporate Refusal", "Credit Hold", "Customer Refusal",
    "Diamond", "Enrollment", "Failed 2X in Calendar Year", "Gold",
    "Institutional", "No Program", "Platinum", "RSVP", "Silver"
    ), class = "factor")), class = "data.frame", row.names = c(NA,
-12L), vars = "PROGRAM_LEVEL_DESCR", drop = TRUE), indices = list(
    0:4, 5:12, 13:17, 18:22, 23:31, 32L, 33:42, 43:51, 52:61,
    62:71, 72L, 73:82), drop = TRUE, group_sizes = c(5L, 8L,
5L, 5L, 9L, 1L, 10L, 9L, 10L, 10L, 1L, 10L), biggest_group_size = 10L)
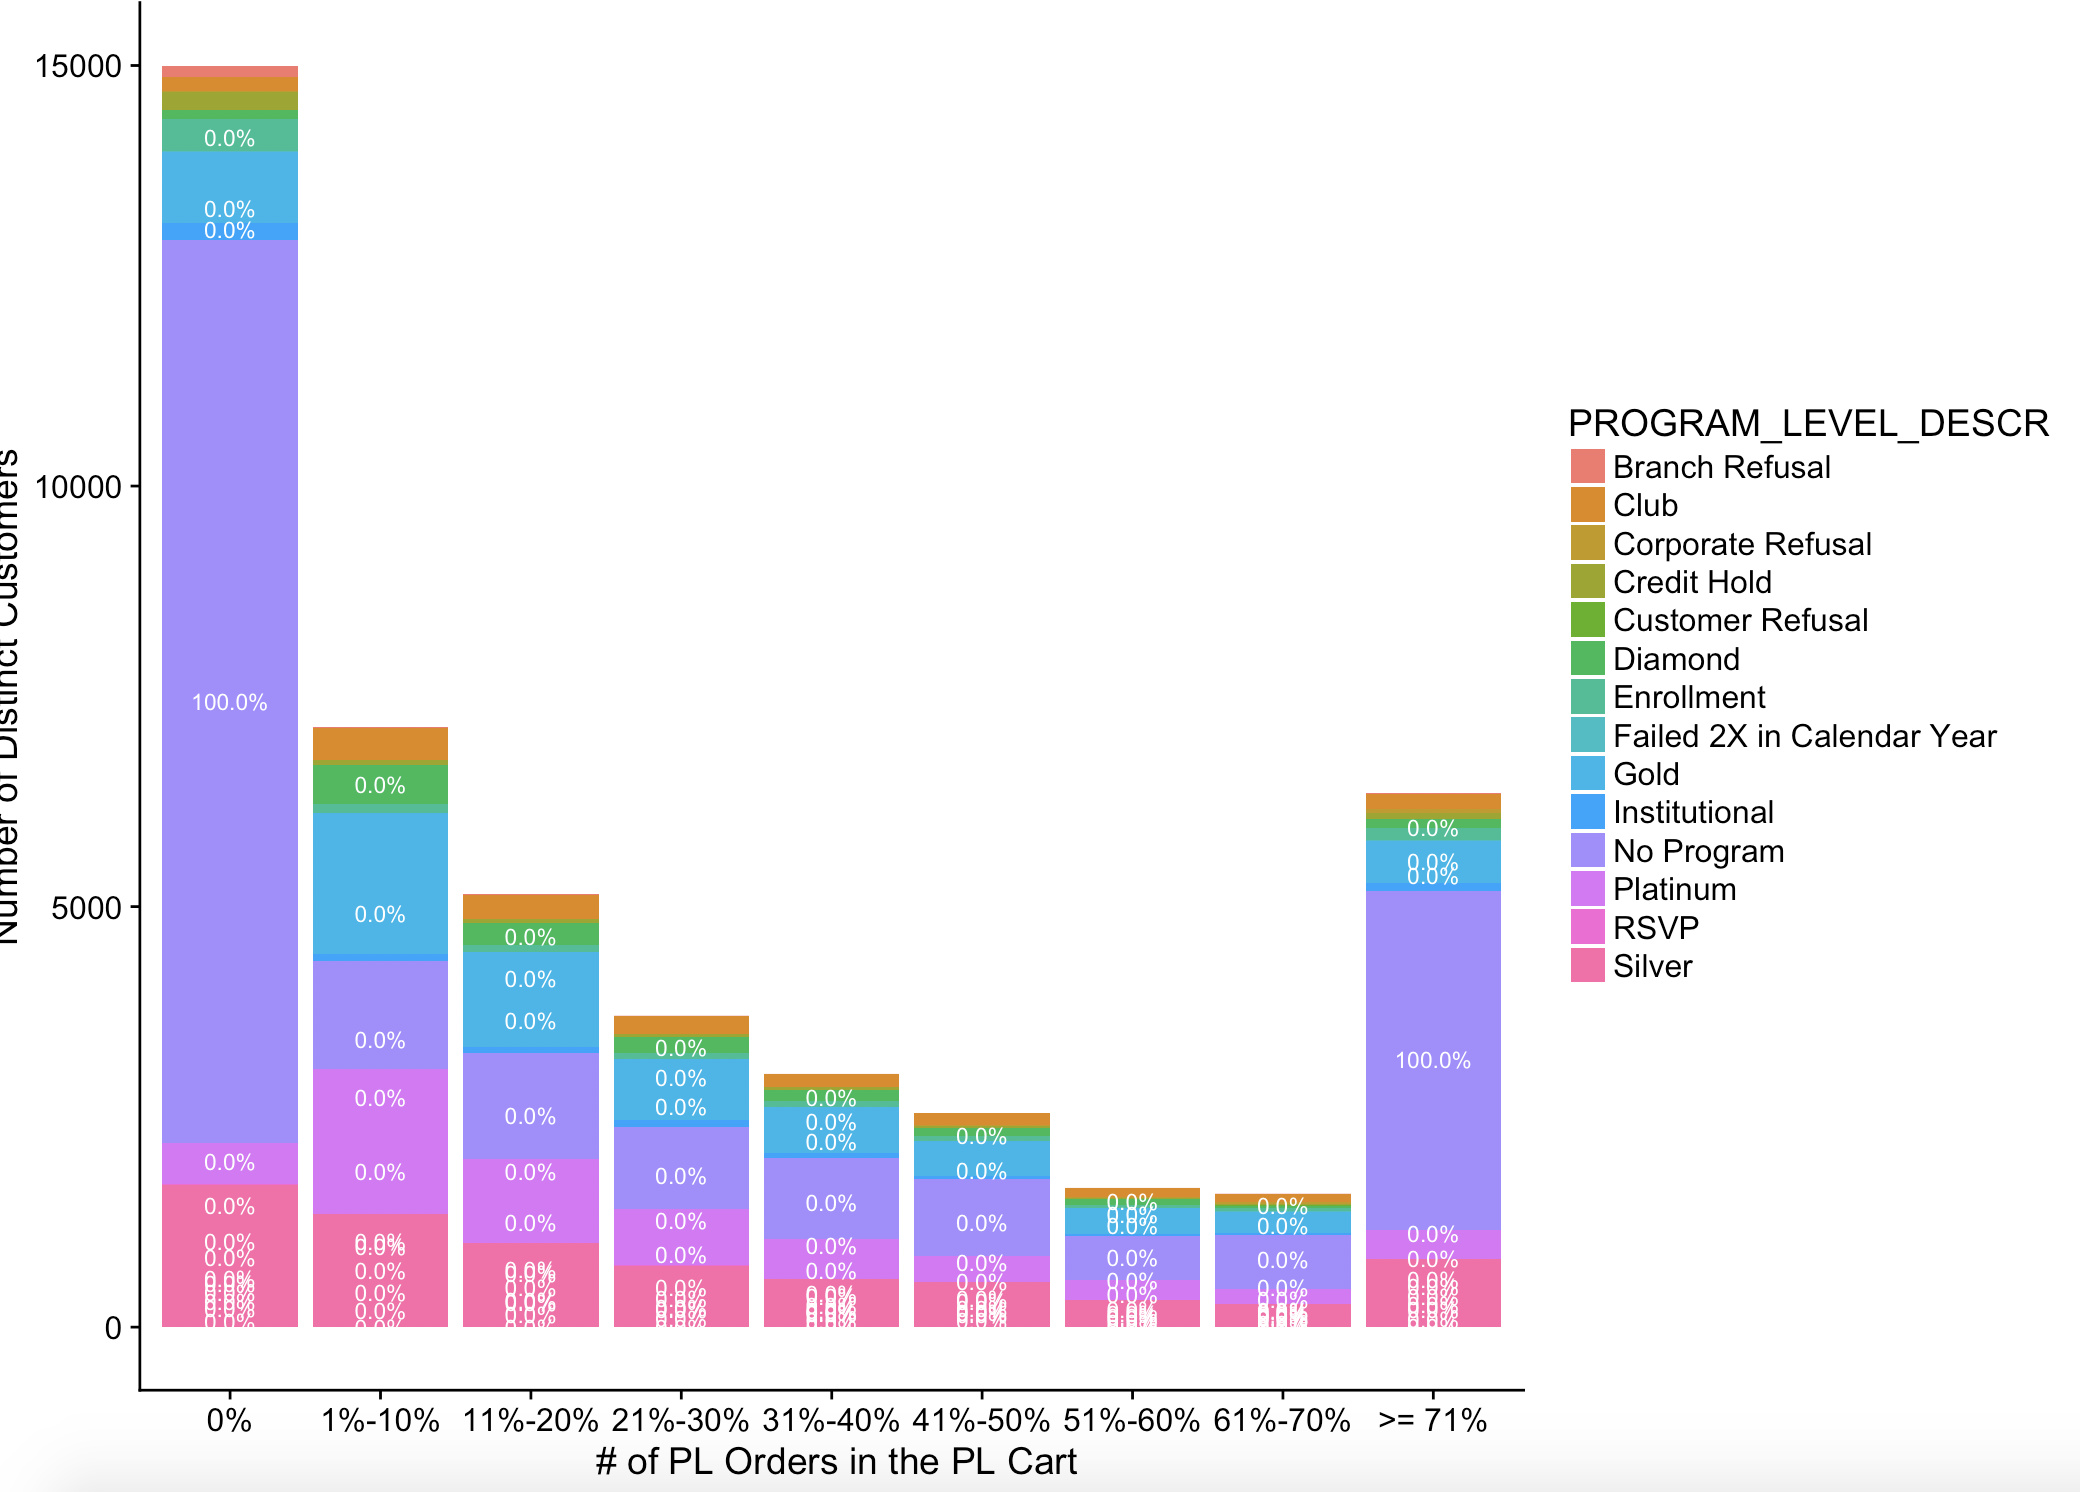
I have a sample plot which I do not know how to fix/plot the way I intended to.
My code:
Summary
df2a1 <- df2a %>% group_by(PROGRAM_LEVEL_DESCR,category) %>% summarise(count=n()) %>%
  mutate(percent= paste0(round(count/sum(count)*100,1),'%'))

plot_df2a1 = ggplot(df2a1) + geom_bar(aes(x=category,y=count, fill = PROGRAM_LEVEL_DESCR),stat='identity') +
  labs(y='Number of Distinct Customers',x=' # of PL Orders in the PL Cart')+
  geom_text(aes(x=category,y=count,label=percent),vjust=-0.5)
My goal:
- First, I still want my x-axis to be category and my y-axis to be number of customers.
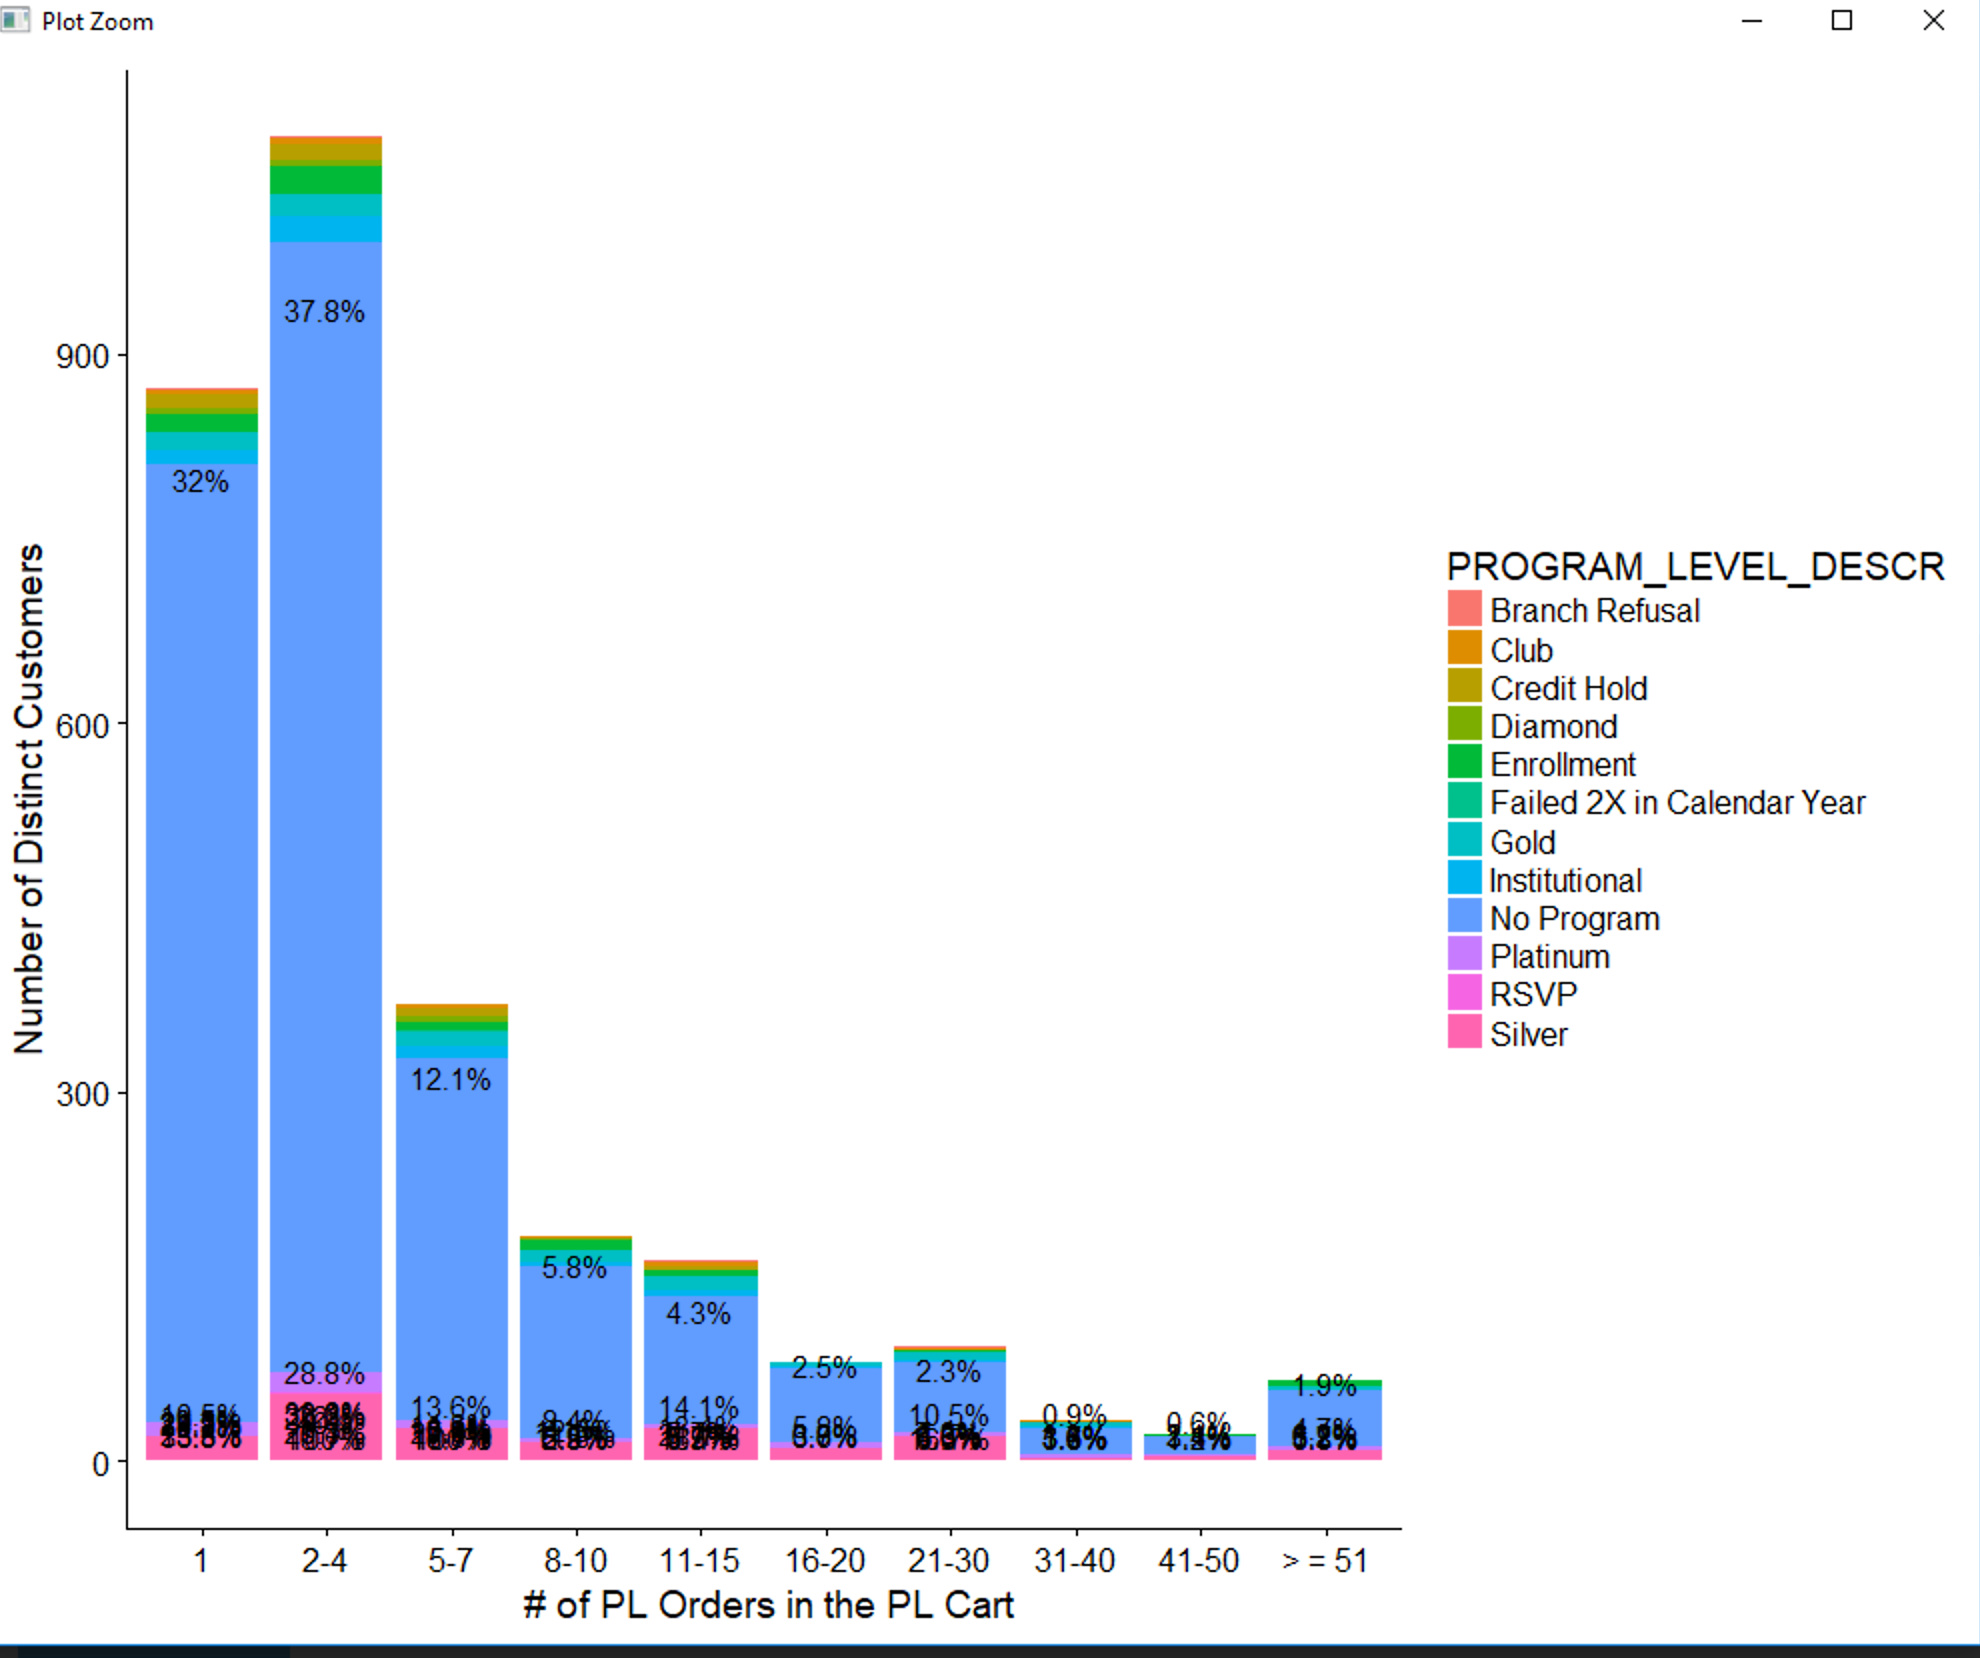
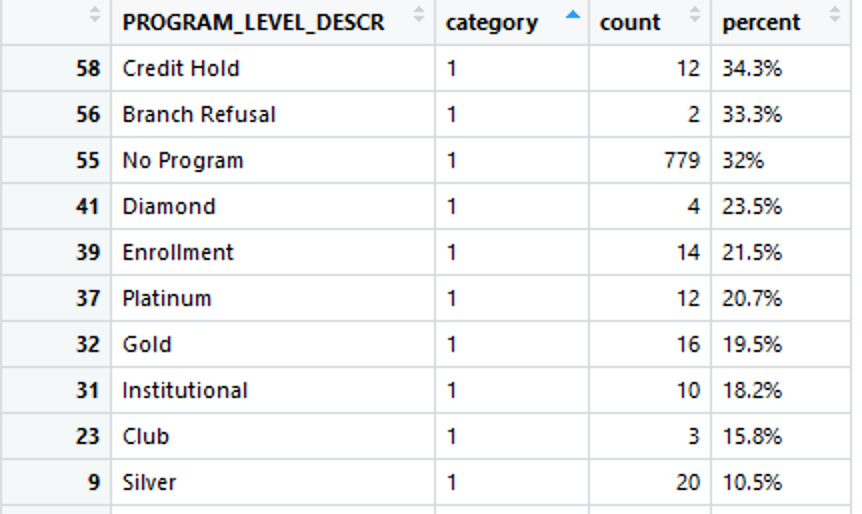
- Second, I want to see the segmentation within each column for each category marked on the x-axis if my description makes sense. For instance, for the bar at x = 1, I know there are 32% of customers buy only 1 item, but I do want to know what groups make up of the whole column of 32%, based on my column in the data set called "Customer Program Description".
For example, if I am making sense,
for category "1", there are 10 different customer segments within this category, so I want to implement these segments in this column.
I hope my post is detailed enough.
Please keep me posted with the feedback.
Thanks, team!