I don't work with gridded data very often, by climate science standards, but a recent analysis had me doing some small operations on some gridded NetCDF data: monthly occurrences of records in grid cells over Australia.
I wanted to derive from this the age of records for each grid cell and timestep. I chose to use the super-handy tidync package to pull out a data frame using hyper_tibble, group by grid cell (longitude + latitude) and use tidyr::fill to work it out:
rec_txa =
  # get the netcdf into a data frame
  tidync(
    here('analysis', 'data', 'record-ts', 'monthly-TXmean-records.nc')) %>%
  activate('hot_record_time') %>% .
  hyper_tibble() %T>%
  # tidy up a little
  print() %>%
  mutate(record = as.logical(hot_record_time)) %>%
  select(-hot_record_time) %>%
  arrange(time) %>%
  # cell-by-cell: find the time since the last record
  group_by(longitude, latitude) %>%
  mutate(last_record = if_else(record, true = time, false = NA_integer_)) %>%
  fill(last_record) %>%
  mutate(
    record_age = time - last_record,
    record_age_clamped = case_when(
      record_age > 120 ~ NA_integer_,
      TRUE ~ record_age
    )) %>%
  select(-last_record) %>%
  ungroup() %>%
  # convert time column to actual dates
  mutate(date = as.Date('1950-01-15') + months(time - 1)) %T>%
  print()
In this case it was fast enough for my needs: on the order of 10 seconds on my 2014 MBP for what was a ~2M row data frame (2000 cells * 1000 months). However, I'm aware that tidync also has a hyper_array function, and I'm not very familiar with R's matrix tools. Would it be quicker to dump to an array and use other tools to do this work? Or is there some possible performance benefit from hyper_tibble accepting a grouping argument to skip dumping the whole thing into a single data frame before splitting it up again?
I mostly ask because it's pretty typical for me to do embarrassingly parallelisable work on gridded data (either by grid cell, working on time series one at a time, or grouping by timestep to aggregate spatially), and in my PhD work I've mostly outsourced this kinda thing with bigger datasets to dedicated tools like CDO, at the expense of readability. But for many of my colleagues who're Python users, xarray's similar split-apply-combine workflow is often used for analysis on model output.

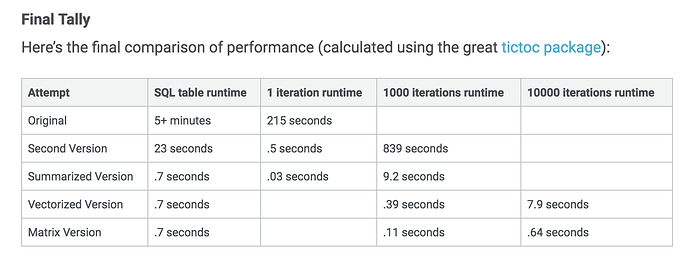
 I particularly appreciate that Emily's article has a section on weighing up the speed boost from switching to matrix operations against the readability of tidy tools