Overview
I have produced four models using the tidymodels package with the data frame FID (see below):
- General Linear Model
- Bagged Tree
- Random Forest
- Boosted Trees
The data frame contains three predictors:
- Year (numeric)
- Month (Factor)
- Days (numeric)
The dependent variable is Frequency (numeric)
I am following this tutorial:-
Issue
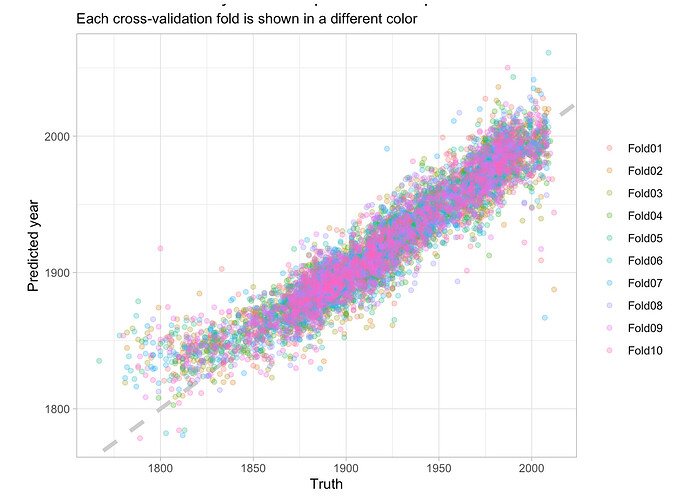
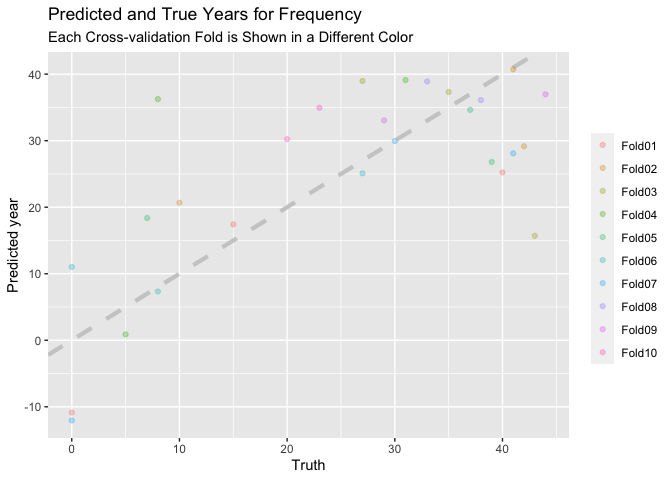
I would like to plot the quantitative estimates for how well my model performed and whether these values can be compared across different kinds of models. I want to visually show the predicted frequency (dependent variable) plotted against the true frequency when they were published (see an example of what I want to plot below), for all the resampled datasets.
I am experiencing this error message
Error in FUN(X[[i]], ...) : object 'Frequency' not found
If anyone can help me with this error, I would be deeply appreciative.
Many thanks in advance.
R-Code
##Open the tidymodels package

library(tidymodels)
library(glmnet)
library(parsnip)
library(rpart.plot)
library(rpart)
library(tidyverse) # manipulating data
library(skimr) # data visualization
library(baguette) # bagged trees
library(future) # parallel processing & decrease computation time
library(xgboost) # boosted trees
library(ranger)
library(yardstick)
library(purrr)
library(forcats)
library(ggplot)

#split this single dataset into two: a training set and a testing set
data_split <- initial_split(FID)

##Create data frames for the two sets:
train_data <- training(data_split)
test_data  <- testing(data_split)

##Resample the data with 10-fold cross-validation (10-fold by default)
cv <- vfold_cv(train_data, v=10)

###########################################################
##Produce the recipe

rec <- recipe(Frequency ~ ., data = FID) %>%
          step_nzv(all_predictors(), freq_cut = 0, unique_cut = 0) %>% # remove variables with zero variances
          step_novel(all_nominal()) %>% # prepares test data to handle previously unseen factor levels
          step_medianimpute(all_numeric(), -all_outcomes(), -has_role("id vars"))  %>% # replaces missing numeric observations with the median
          step_dummy(all_nominal(), -has_role("id vars")) # dummy codes categorical variables

##########################################################
##Produce Models
##########################################################
##General Linear Models
##########################################################

##Produce the glm model
mod_glm<-linear_reg(mode="regression",
                       penalty = 0.1,
                       mixture = 1) %>%
                            set_engine("glmnet")

##Create workflow
wflow_glm <- workflow() %>%
                add_recipe(rec) %>%
                      add_model(mod_glm)

##Fit the model

#############################################################
##Estimate how well that model performs, let’s fit many times,
##once to each of these resampled folds, and then evaluate on the held out
##part of each resampled fold.
#############################################################

plan(multisession)

fit_glm <- fit_resamples(
                        wflow_glm,
                        cv,
                        metrics = metric_set(rmse, rsq),
                        control = control_resamples(save_pred = TRUE)
                        )

##Collect model predictions for each fold for the frequency

Predictions<-fit_glm %>%
                  collect_predictions()

Predictions

##Plot the predicted and true values
fit_glm %>%
      collect_predictions() %>%
      ggplot(aes(Frequency, .pred, color = id)) +
      geom_abline(lty = 2, color = "gray80", size = 1.5) +
      geom_point(alpha = 0.3) +
      labs(
      x = "Truth",
      y = "Predicted year",
      color = NULL,
      title = "Predicted and True Years for Frequency",
      subtitle = "Each Cross-validation Fold is Shown in a Different Color"
      )`
Desired Plot
Data Frame - FID
structure(list(Year = c(2015, 2015, 2015, 2015, 2015, 2015, 2015,
2015, 2015, 2015, 2015, 2015, 2016, 2016, 2016, 2016, 2016, 2016,
2016, 2016, 2016, 2016, 2016, 2016, 2017, 2017, 2017, 2017, 2017,
2017, 2017, 2017, 2017, 2017, 2017, 2017), Month = structure(c(5L,
4L, 8L, 1L, 9L, 7L, 6L, 2L, 12L, 11L, 10L, 3L, 5L, 4L, 8L, 1L,
9L, 7L, 6L, 2L, 12L, 11L, 10L, 3L, 5L, 4L, 8L, 1L, 9L, 7L, 6L,
2L, 12L, 11L, 10L, 3L), .Label = c("April", "August", "December",
"February", "January", "July", "June", "March", "May", "November",
"October", "September"), class = "factor"), Frequency = c(36,
28, 39, 46, 5, 0, 0, 22, 10, 15, 8, 33, 33, 29, 31, 23, 8, 9,
7, 40, 41, 41, 30, 30, 44, 37, 41, 42, 20, 0, 7, 27, 35, 27,
43, 38), Days = c(31, 28, 31, 30, 6, 0, 0, 29, 15,
29, 29, 31, 31, 29, 30, 30, 7, 0, 7, 30, 30, 31, 30, 27, 31,
28, 30, 30, 21, 0, 7, 26, 29, 27, 29, 29)), row.names = c(NA,
-36L), class = "data.frame")
