This is a thread for STAT 412/612 students to practice preparing and sharing code questions using minimal reproducible examples (reprexes). There is no need to respond to these questions, as we're just practicing ![]()
1 Like
Deirdre Belson, Wesley Wilson, and Aaditi Narayanan
We are trying to create a histogram that shows the distribution speed. Why are we getting this error?
library(tidyverse)

just_speed <- cars[, "speed"]
ggplot(just_speed, aes(x = speed)) +
  geom_histogram()
#> Error: `data` must be a data frame, or other object coercible by `fortify()`, not a numeric vector
Created on 2021-02-23 by the reprex package (v1.0.0)
1 Like
Hello,
I am trying to create a histogram of temperature ("Temp") from the AirQuality dataset (in R). Why am I getting this error? Many thanks.
library(tidyverse)
airquality <- datasets::airquality
just_Temp <- airquality[, "Temp"]
ggplot(just_Temp, aes(x = Temp)) +
  geom_histogram()
#> Error: `data` must be a data frame, or other object coercible by `fortify()`, not an integer vector
1 Like
Erik Montano, Sareeta Schmitt, Chang Liu, Leena S.
I am trying to create a histogram that only uses the mpg column from the mtcars dataset.
library(tidyverse)
just_mpg <- mtcars[, "mpg"]
ggplot(just_mpg, aes(x = mpg)) +
  geom_histogram()
#> Error: `data` must be a data frame, or other object coercible by `fortify()`, not a numeric vector
Created on 2021-02-23 by the reprex package (v1.0.0)
1 Like
Hello R Community!
My group is having trouble getting a histogram to display. I've provided the minimum reproducible code chunk and error message below. Would you be able to help troubleshoot to get us back on track?
Thank you in advance,
Group 5
# Load the required library
library(ggplot2)

# Base R Dataset
cars <- datasets::cars

# Make histogram of speed variable
just_speed <- cars[, "speed"]
ggplot(just_speed, aes(x = height)) +
  geom_histogram()

#> Error: `data` must be a data frame, or other object coercible by `fortify()`, not a numeric vector
1 Like
Jan Herchold, Nikola Jok, Alex Jacoby
When I run this I'm hoping to get a histogram, but instead I'm getting the error that the data must be a data frame, not an integer vector.
How do I make a histogram of an integer vector?
library(tidyverse)
vals <- 1:50
ggplot(vals, aes(x = vals)) +
  geom_histogram()
#> Error: `data` must be a data frame, or other object coercible by `fortify()`, not an integer vector
Many thanks!
The Stats 412/612 Crew
1 Like
Saleh Aldrees and Vi Ho
we are trying to build a histogram, but it looks like this
library(tidyverse)
library(ggplot2)
just_hp <- mtcars[,"hp"]
ggplot(just_hp, aes(x = hp)) +
  geom_histogram()
#> Error: `data` must be a data frame, or other object coercible by `fortify()`, not a numeric vector
1 Like
Hello Community,
My group has been having some difficulty producing a histogram from this code using the "mtcars" dataset in r.
Any help would be appreciated, Group 3
library(tidyverse)
rides <- mtcars[, "mpg"]
ggplot(rides, aes(x = mpg)) +
  geom_histogram()
#> Error: `data` must be a data frame, or other object coercible by `fortify()`, not a numeric vector
1 Like
Thanks, everyone, for the great reprexes, and welcome to RStudio Community!
It turns out that the real issue is a quirk of base R. read.csv() returns a regular data frame, and when we try to subset a single column in a data frame, R converts the object to a vector:
x <- data.frame(a = 1:5)

x
#>   a
#> 1 1
#> 2 2
#> 3 3
#> 4 4
#> 5 5

x[, "a"]
#> [1] 1 2 3 4 5

is.data.frame(x[, "a"])
#> [1] FALSE
ggplot() expects a data frame, not a vector. When you're dealing with base R, the solution is to set drop = FALSE, which keeps x as a data frame.
x[, "a", drop = FALSE]
#>   a
#> 1 1
#> 2 2
#> 3 3
#> 4 4
#> 5 5

is.data.frame(x[, "a", drop = FALSE])
#> [1] TRUE
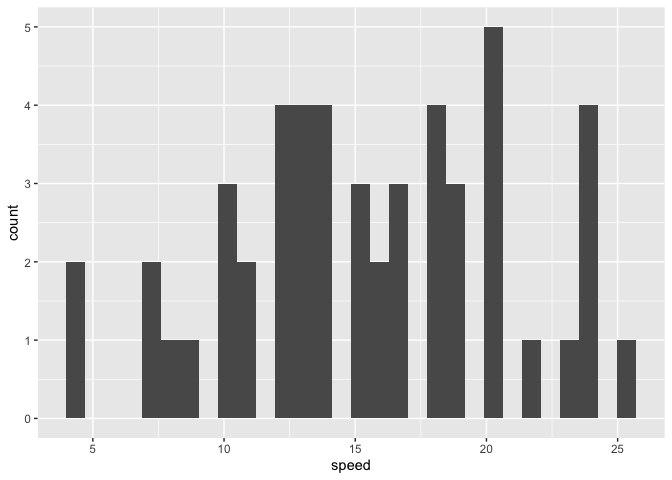
Using this approach will fix our issue (using @Deirdre_Belson and crew's example):
library(ggplot2)
just_speed <- cars[, "speed", drop = FALSE]
ggplot(just_speed, aes(x = speed)) +
  geom_histogram()
#> `stat_bin()` using `bins = 30`. Pick better value with `binwidth`.
Notably, the original code used read.csv(), which returns a regular data frame, but readr::read_csv() returns a tibble, a special case of the data frame. Tibbles don't have this behavior, and subsetting them always returns a tibble:
library(tidyverse)
y <- tibble(a = 1:5)
y[, "a"]
#> # A tibble: 5 x 1
#>       a
#>   <int>
#> 1     1
#> 2     2
#> 3     3
#> 4     4
#> 5     5
Using a tibble also solves our problem:
library(tidyverse)
cars <- as_tibble(cars)
just_speed <- cars[, "speed"]
ggplot(just_speed, aes(x = speed)) +
  geom_histogram()
#> `stat_bin()` using `bins = 30`. Pick better value with `binwidth`.
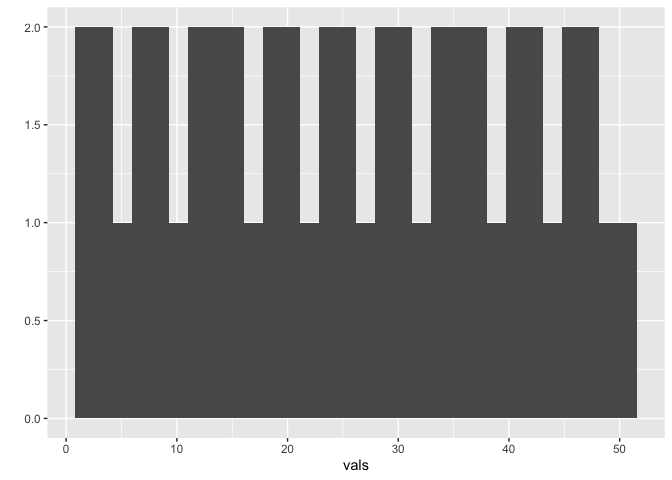
Interestingly, @ajacoby and crew posed a different but equally valid question: can we make histograms out of integer vectors? ggplot2's quickplot() function does this by default:
library(ggplot2)
vals <- 1:50
quickplot(vals)
#> `stat_bin()` using `bins = 30`. Pick better value with `binwidth`.
Of course, we can always wrap vals in a data frame (e.g. data.frame(vals = vals) or tibble(vals = vals)), then call ggplot() as normal.
Great work, everyone!
1 Like
This topic was automatically closed 7 days after the last reply. New replies are no longer allowed.
If you have a query related to it or one of the replies, start a new topic and refer back with a link.