This is a thread for DATA 412/612 students to practice preparing and sharing code questions using minimal reproducible examples (reprexes). There is no need to respond to these questions, as we're just practicing ![]()
1 Like
Hello, I am having some difficulty creating a histogram of my data in R. I would like to use ggplot to create a histogram in R that shows the distribution of the heights in my data. However, ggplot seems unable to plot the values in my 'height' column, as it doesn't recognize my subsetted data, 'just_height' as a data frame object. How can I either turn my 'just_height' data into a data frame or use ggplot to plot a list? Thanks for the help!
# Load library
library(tidyverse)

# Create data
diabetes <- data.frame(height = c(1,1,1,2,2,2,2,2,3,3),
                   chol = c(1,3,2,4,2,1,1,3,1,2))

# Extract height column
just_height <- diabetes[, "height"]

# Plot
ggplot(just_height, aes(x = height)) +
  geom_histogram()
#> Error in `fortify()`:
#> ! `data` must be a <data.frame>, or an object coercible by `fortify()`,
#>   not a double vector.
#> Backtrace:
#>     ▆
#>  1. ├─ggplot2::ggplot(just_height, aes(x = height))
#>  2. └─ggplot2:::ggplot.default(just_height, aes(x = height))
#>  3.   ├─ggplot2::fortify(data, ...)
#>  4.   └─ggplot2:::fortify.default(data, ...)
#>  5.     └─cli::cli_abort(msg)
#>  6.       └─rlang::abort(...)
Created on 2023-11-11 with reprex v2.0.2
Good afternoon,
I am having a problem with creating a histogram of my data in R. I would like to use ggplot to create a histogram in R using my 'just_height' data to produce a distribution of heights from the diabetes dataset. However, ggplot is unable to plot the values from my 'height' column when I call the subset data 'just_height' as a dataframe object. How can I change 'just_height' into a dataframe with the 'height' data from diabetes that will allow ggplot to plot a histogram? Thank you!
#Load Library
library(tidyverse)

#Create Dataset: Height in inches and Weight in pounds
diabetes <- data.frame(height = c(74, 69, 58, 54, 74, 80, 80, 69),
                       weight = c(120, 135, 95, 102, 110, 170, 165, 128))

#Get just the height column
just_height <- diabetes[, "height"]

#Plot the dataset
ggplot(just_height, aes(x = height)) +
  geom_histogram()
#> Error in `fortify()`:
#> ! `data` must be a <data.frame>, or an object coercible by `fortify()`,
#>   not a double vector.
#> Backtrace:
#>     ▆
#>  1. ├─ggplot2::ggplot(just_height, aes(x = height))
#>  2. └─ggplot2:::ggplot.default(just_height, aes(x = height))
#>  3.   ├─ggplot2::fortify(data, ...)
#>  4.   └─ggplot2:::fortify.default(data, ...)
#>  5.     └─cli::cli_abort(msg)
#>  6.       └─rlang::abort(...)
Created on 2023-11-13 with reprex v2.0.2
Hello, I was attempting to create a histogram of the variable "height" which was extracted from the diabetes dataset which was created as a data frame object. However, when creating the histogram using ggplot2 my code produces an error. When I attempt to coerce the height variable using the function as.data.frame() in the aesthetic x axis in ggplot2 it produces the same error. Is the error due to list subsetting only the height variable from the diabetes dataset? How do I produce the histogram of height_only without error? Thank you for your help!
# load Tidyverse package
library(tidyverse)

# set seed for random numbers
set.seed(101)

# Create dataset
diabetes_data <- data.frame(
  ID = 1:50,
  height = round(runif(50, min = 165, max = 180), 2),
  weight = runif(50, min = 91, max = 300),
  hba1c = runif(50, min = 5.5, max = 13),
  cholesterol_total = runif(50, min = 100, max = 450)
)

# Extract height from diabetes data set
height_only <- diabetes_data[, "height"]

# plot histogram of height
ggplot(data = height_only, aes(x = height)) +
  geom_histogram()
#> Error in `fortify()`:
#> ! `data` must be a <data.frame>, or an object coercible by `fortify()`,
#>   not a double vector.
#> Backtrace:
#>     ▆
#>  1. ├─ggplot2::ggplot(data = height_only, aes(x = height))
#>  2. └─ggplot2:::ggplot.default(data = height_only, aes(x = height))
#>  3.   ├─ggplot2::fortify(data, ...)
#>  4.   └─ggplot2:::fortify.default(data, ...)
#>  5.     └─cli::cli_abort(msg)
#>  6.       └─rlang::abort(...)
Created on 2023-11-13 with reprex v2.0.2
I am trying to plot a histogram in this code. The problem that this code is giving me is that the histogram that is supposed to display is not displaying. In the place where it is supposed to show a histogram, my code is instead giving me an error that says "Error in 'fortify()'." It says that the data has to be a data frame and that it cannot be a double vector. The question that needs to be answered is why is it that "height_solo" is not being recognized as the data frame that I intended to make it? I would appreciate whatever help you can provide here. Thank you so much!
library(tidyverse)

#This makes a dataset with columns "height" in inches, "age" in years and "hdl" cholesterol in milligrams.
diabetes_info <- data.frame(height = c(67, 75, 71, 59, 62, 68, 73, 70, 60, 64, 53, 55),
                            age = c(46, 59, 63, 44, 36, 63, 38, 39, 29, 27, 23, 65),
                            hdl = c(39, 71, 68, 54, 57, 52, 39, 44, 62, 37, 49, 75))

#This reduces the number of columns in "diabetes_info" from three to one: "height" being the one column.
height_solo <- diabetes_info[, "height"]

#The following two lines plot the dataset "height_solo" on a histogram. The sole column "height" is the x-axis.
ggplot(height_solo, aes(x = height)) +
  geom_histogram()
#> Error in `fortify()`:
#> ! `data` must be a <data.frame>, or an object coercible by `fortify()`,
#>   not a double vector.
#> Backtrace:
#>     ▆
#>  1. ├─ggplot2::ggplot(height_solo, aes(x = height))
#>  2. └─ggplot2:::ggplot.default(height_solo, aes(x = height))
#>  3.   ├─ggplot2::fortify(data, ...)
#>  4.   └─ggplot2:::fortify.default(data, ...)
#>  5.     └─cli::cli_abort(msg)
#>  6.       └─rlang::abort(...)
Hey, y'all! I am having an issue with generating a histogram. I am trying to use ggplot2 to create a histogram showing the distribution of the height of people within my given dataset. My code runs with an error in "fortify()," suggesting that my intended use of the height variable as a data frame is failing. I am really stuck, and any help you could provide would be greatly appreciated!
# Load in your library
library(tidyverse)

# Call built-in Dataset
women

# Specify Height Collum
just_height <- women[, "height"]

# Plot Data using ggplot2
ggplot(just_height, aes(x = height)) +
  geom_histogram()

#> Error in `fortify()`:
#> ! `data` must be a <data.frame>, or an object coercible by `fortify()`,
#>   not a double vector.
#> Backtrace:
#>     ▆
#>  1. ├─ggplot2::ggplot(just_height, aes(x = height))
#>  2. └─ggplot2:::ggplot.default(just_height, aes(x = height))
#>  3.   ├─ggplot2::fortify(data, ...)
#>  4.   └─ggplot2:::fortify.default(data, ...)
#>  5.     └─cli::cli_abort(msg)
#>  6.       └─rlang::abort(...)
Created on 2023-11-19 with reprex v2.0.2
Good afternoon, I am having difficulty creating a histogram of my R data. The goal was to create a histogram that showed the distribution of heights in the diabetes dataset. However, the ggplot was unable to plot the height column values since it did nit recognized the extracted data in just_diabetes_height as a data frame object. How can I turn my extracted data into a proper data frame for ggplot to use to plot the histogram? Thanks!
#load Tidyverse package
library(tidyverse)


#Create dataset
diabetes_data <- data.frame(
  height = c(75, 60, 50, 50, 80, 69, 75, 55),
  weight = c(110, 180, 200, 130, 95, 160, 120, 100))


#Extract height from diabetes data set
just_diabetes_height <- diabetes_data[, "height"]

#plot histogram of height
ggplot(data = just_diabetes_height, aes(x = height)) +
  geom_histogram()

 <error/rlang_error>
`data` must be a data frame, or other object coercible by `fortify()`, not a numeric vector
Backtrace:
 1. ggplot2::ggplot(data = just_diabetes_height, aes(x = height))
 2. ggplot2:::ggplot.default(data = just_diabetes_height, aes(x = height))
 4. ggplot2:::fortify.default(data, ...)
Hi! Please help with the following error. I am working with a dataset imported through a csv file and I receive an error where ggplot cannot plot a selected x variable of numeric data. The following example uses the base r dataset "sleep" to reproduce the same error I receive when working with csv data. Just as is the case when I try to isolate the values of one column to plot as a histogram with my actual data, I receive an error that looks like ggplot cannot work with the numeric format/values of the column of interest I want to plot . Does anyone know what might be going on? Is there another way to write this code to plot a histogram of one column of data? Thanks!
just_extra <- sleep[,"extra"]

library(tidyverse)
ggplot(just_extra, aes(x = extra)) +
  geom_histogram()
#> Error in `fortify()`:
#> ! `data` must be a <data.frame>, or an object coercible by `fortify()`,
#>   not a double vector.
#> Backtrace:
#>     ▆
#>  1. ├─ggplot2::ggplot(just_extra, aes(x = extra))
#>  2. └─ggplot2:::ggplot.default(just_extra, aes(x = extra))
#>  3.   ├─ggplot2::fortify(data, ...)
#>  4.   └─ggplot2:::fortify.default(data, ...)
#>  5.     └─cli::cli_abort(msg)
#>  6.       └─rlang::abort(...)
Created on 2023-11-19 with reprex v2.0.2
Hey y'all,
I am having trouble plotting my desired data for a data frame regarding diabetes data. I am inputting code to create a histogram for a column displaying the height of involved subjects, titled "height_only," but am continually facing an error message stating "error in fortify()." Additionally, it says that my data "must be either a data frame or an object coercible by "fortify()." Your help would be greatly appreciated! Thank y'all so much!
#Load Library
library(tidyverse)

#Read the data
diabetes <- read.csv("https://raw.githubusercontent.com/malcolmbarrett/au-stats412-612-01-reading_data/master/diabetes.csv")

#Obtain the height column only
height_only <- diabetes[, "height"]

#Plot data
ggplot(height_only, aes(x = height)) +
  geom_histogram()
#> Error in `fortify()`:
#> ! `data` must be a <data.frame>, or an object coercible by `fortify()`,
#>   not an integer vector.
#> Backtrace:
#>     ▆
#>  1. ├─ggplot2::ggplot(height_only, aes(x = height))
#>  2. └─ggplot2:::ggplot.default(height_only, aes(x = height))
#>  3.   ├─ggplot2::fortify(data, ...)
#>  4.   └─ggplot2:::fortify.default(data, ...)
#>  5.     └─cli::cli_abort(msg)
#>  6.       └─rlang::abort(...)
Hello, I am trying to create a histogram of my data set and am getting an error that I do not know how to fix. I started with the built-in dataset "women" and then made a second dataframe (just_heights) to pull out only the height information from the data set. My goal is to have a histogram with weights on the x axis, but I am getting an " Error in fortify()" message as shown below. I made a second dataframe (just_heights) to pull out only the height information from the data set. I would love any ideas for what I need to fix in my code to solve this error. Thank you!
#Open ggplot library
library(ggplot2)
#Call an existing example data set
datasets::women
#>    height weight
#> 1      58    115
#> 2      59    117
#> 3      60    120
#> 4      61    123
#> 5      62    126
#> 6      63    129
#> 7      64    132
#> 8      65    135
#> 9      66    139
#> 10     67    142
#> 11     68    146
#> 12     69    150
#> 13     70    154
#> 14     71    159
#> 15     72    164
#Create a new df with only height measurements
just_height <- women[, "height"]
#Create a histogram for the height variable
ggplot(just_height, aes(x = height)) +
  geom_histogram()
#> Error in `fortify()`:
#> ! `data` must be a <data.frame>, or an object coercible by `fortify()`,
#>   not a double vector.
#> Backtrace:
#>     ▆
#>  1. ├─ggplot2::ggplot(just_height, aes(x = height))
#>  2. └─ggplot2:::ggplot.default(just_height, aes(x = height))
#>  3.   ├─ggplot2::fortify(data, ...)
#>  4.   └─ggplot2:::fortify.default(data, ...)
#>  5.     └─cli::cli_abort(msg)
#>  6.       └─rlang::abort(...)
Created on 2023-11-19 with reprex v2.0.2
Thanks, everyone, for attempting reprexes, and welcome to Posit Community!
Now, to fix the code!
First, good job on making sure you've loaded the necessary package (here, ggplot2 by either loading that specific package or the tidyverse). Missing that is a common mistake in reprexes.
Technically, we could also make this example more minimal. The problem is not actually with the diabetes dataset, so we could use a built-in dataset to show the problem. However, our example is still reproducible (since the data is on GitHub and the code does read it correctly). Since you may not be sure if it's the data or code that's the problem, it's reasonable to include that dataset. As some of you show, we can also create a dummy data frame with data.frame() that also shows the issue.
It turns out that the real issue is a quirk of base R. read.csv() returns a regular data frame, as does data.frame(), and when we try to subset a single column in a data frame, R converts the object to a vector, not a dataframe:
x <- data.frame(a = 1:5)

x
#>   a
#> 1 1
#> 2 2
#> 3 3
#> 4 4
#> 5 5

x[, "a"]
#> [1] 1 2 3 4 5

is.data.frame(x[, "a"])
#> [1] FALSE
ggplot() expects a data frame, not a vector. When you're dealing with base R, the solution is to set drop = FALSE, which keeps x as a data frame.
x[, "a", drop = FALSE]
#>   a
#> 1 1
#> 2 2
#> 3 3
#> 4 4
#> 5 5

is.data.frame(x[, "a", drop = FALSE])
#> [1] TRUE
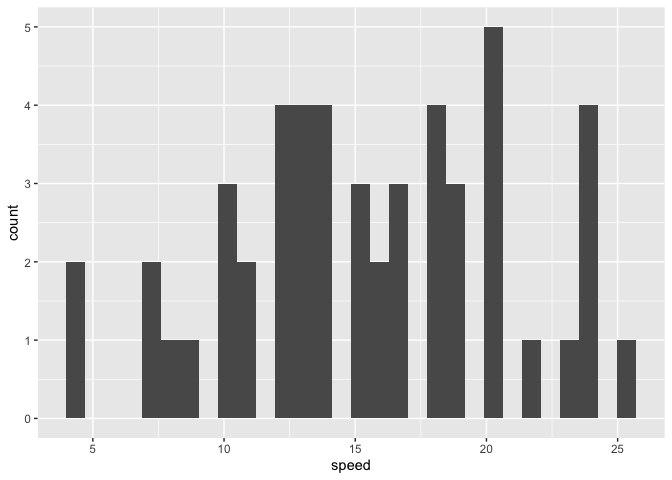
Using this approach will fix our issue. I don't actually need the diabetes dataset here, so instead, I'll use the built-in cars dataset and make a histogram of the speed variable, as some of you have done.
library(ggplot2)
just_speed <- cars[, "speed", drop = FALSE]
ggplot(just_speed, aes(x = speed)) +
  geom_histogram()
#> `stat_bin()` using `bins = 30`. Pick better value with `binwidth`.
Notably, the original code used read.csv(), which returns a regular data frame, but readr::read_csv() returns a tibble, a special case of the data frame. Tibbles don't have this behavior, and subsetting them always returns a tibble. We don't need drop = FALSE:
library(tidyverse)
y <- tibble(a = 1:5)
y[, "a"]
#> # A tibble: 5 x 1
#>       a
#>   <int>
#> 1     1
#> 2     2
#> 3     3
#> 4     4
#> 5     5
Using a tibble also solves our problem:
library(tidyverse)
cars <- as_tibble(cars)
just_speed <- cars[, "speed"]
ggplot(just_speed, aes(x = speed)) +
  geom_histogram()
#> `stat_bin()` using `bins = 30`. Pick better value with `binwidth`.
Good afternoon,
I am having trouble creating a histogram of my data in R. I would like to create a histogram using ggpot showing a distribution of height and glyhb in the diabetes dataset. Ggplot is unable to plot my data. The error message I received indicates that the input must be in the form of a data frame and cannot be a double vector. Thank you for your help!
library(tidyverse)

#Create the data
diabetes <- data.frame(height = c(64, 65, 67, 60, 66, 70, 48, 49),
                       glyhb = c(4.41, 5.62, 11.20, 10.91, 5.66, 7.88, 4.44, 9.87))
#Get the just height column
just_height <- diabetes[, "height"]

#Plot the data
ggplot(just_height, aes(x = height)) +
  geom_histogram()
#> Error in `fortify()`:
#> ! `data` must be a <data.frame>, or an object coercible by `fortify()`,
#>   not a double vector.
#> Backtrace:
#>     ▆
#>  1. ├─ggplot2::ggplot(just_height, aes(x = height))
#>  2. └─ggplot2:::ggplot.default(just_height, aes(x = height))
#>  3.   ├─ggplot2::fortify(data, ...)
#>  4.   └─ggplot2:::fortify.default(data, ...)
#>  5.     └─cli::cli_abort(msg)
#>  6.       └─rlang::abort(...)
Created on 2023-11-19 with reprex v2.0.2
This topic was automatically closed 7 days after the last reply. New replies are no longer allowed.
If you have a query related to it or one of the replies, start a new topic and refer back with a link.