This is a thread for DATA 412/612 students to practice preparing and sharing code questions using minimal reproducible examples (reprexes). There is no need to respond to these questions, as we're just practicing ![]()
My question for this reprex is about why using the created variable: just_height, doesn't work in ggplot2. I am trying to create a histogram in ggplot2 that has height along the x-axis and count along the y-axis. The code is shown:
library(ggplot2)
#> Warning: package 'ggplot2' was built under R version 4.1.3
diabetes <- read.csv("https://raw.githubusercontent.com/malcolmbarrett/au-stats412-612-01-reading_data/master/diabetes.csv")
just_height <- diabetes[, "height"]
ggplot(just_height, aes(x = height)) +
geom_histogram()
#> Error in fortify():
#> ! data must be a data frame, or other object coercible by fortify(), not an integer vector.
#> Backtrace:
#> x
#> 1. +-ggplot2::ggplot(just_height, aes(x = height))
#> 2. -ggplot2:::ggplot.default(just_height, aes(x = height))
#> 3. +-ggplot2::fortify(data, ...)
#> 4. -ggplot2:::fortify.default(data, ...)
#> 5. -rlang::abort(msg)
Questions answered about creating the reprex:
I expect this to create a histogram using ggplot2 with the different heights along the x-axis and the count of each height along the y-axis but r errors out saying just_height created an integer vector. I included the original data set file path because I could not find a similar built-in data set. I also included every part of the code because it is needed in order for someone else to replicate it to answer my question. Lastly, I added library(ggplot2) to the code so if someone were to try and replicate it, copying and pasting the code chunk is all that would be needed for it to run.
Using the diabetes data set, I'm trying to create a new data set containing only the height column, and creating a histogram of that data set with height on the x-axis. However, instead of creating another data set and a histogram, I got a list of integers titled 'just_height' and an error message for the histogram. What can I add or change in this particular area to give me the desired results?
just_height <- diabetes[, "height"]
library(tidyverse)

diabetes <- read.csv("https://raw.githubusercontent.com/malcolmbarrett/au-stats412-612-01-reading_data/master/diabetes.csv")

just_height <- diabetes[, "height"]
ggplot(just_height, aes(x = height)) +
  geom_histogram()
#> Error in `fortify()`:
#> ! `data` must be a data frame, or other object coercible by `fortify()`, not an integer vector.
I’m trying to make a histogram for the column “height” of the dataset “diabetes” in R. To extract the "height" column, I created a new subset called "just_height" containing only the data for the "height" column and tried to run ggplot using "just_height" as the data to create the histogram I needed. However, I got an error says
"Error in fortify():
! data must be a data frame, or other object coercible by fortify(), not an integer vector."
here is my code, hope someone can help figure out what is going wrong.
library(tidyverse)
diabetes <- read.csv("https://raw.githubusercontent.com/malcolmbarrett/au-stats412-612-01-reading_data/master/diabetes.csv")
just_height <- diabetes[, "height"]
ggplot(just_height, aes(x = height)) +
  geom_histogram()
#> Error in `fortify()`:
#> ! `data` must be a data frame, or other object coercible by `fortify()`, not an integer vector.

#> Backtrace:
#>     ▆
#>  1. ├─ggplot2::ggplot(just_height, aes(x = height))
#>  2. └─ggplot2:::ggplot.default(just_height, aes(x = height))
#>  3.   ├─ggplot2::fortify(data, ...)
#>  4.   └─ggplot2:::fortify.default(data, ...)
#>  5.     └─rlang::abort(msg)
Created on 2022-11-26 with reprex v2.0.2
I am trying to produce a histogram displaying only the heights from the dataset "diabetes". Instead of creating a data frame, my code results in an integer vector "just_height". I cannot create a ggplot histogram using an integer vector.
My first few lines of code are shown below. Can someone help me change the last line so that "just_height" is a data frame instead of an integer vector?
library(tidyverse)
diabetes <- read.csv("https://raw.githubusercontent.com/malcolmbarrett/au-stats412-612-01-reading_data/master/diabetes.csv")
just_height <- diabetes[, "height"]
Created on 2022-11-29 by the reprex package (v2.0.1)
Hi everyone. I am trying to create a histogram using diabetes data, looking specifically at height on the x-axis. See the reprex below of my code. This code should create a histogram with height on the x-axis and count on the y-axis. I'm getting an error message that the data must be a data.frame, and not an integer vector. Any suggestions on what is going wrong are appreciated!
library(tidyverse)
diabetes <- read.csv("https://raw.githubusercontent.com/malcolmbarrett/au-stats412-612-01-reading_data/master/diabetes.csv")
just_height <- diabetes[, "height"]
ggplot(just_height, aes(x = height))
#> Error in `fortify()`:
#> ! `data` must be a <data.frame>, or an object coercible by `fortify()`,
#>   not an integer vector.

#> Backtrace:
#>     ▆
#>  1. ├─ggplot2::ggplot(just_height, aes(x = height))
#>  2. └─ggplot2:::ggplot.default(just_height, aes(x = height))
#>  3.   ├─ggplot2::fortify(data, ...)
#>  4.   └─ggplot2:::fortify.default(data, ...)
#>  5.     └─cli::cli_abort(msg)
#>  6.       └─rlang::abort(...)
Created on 2022-11-30 with reprex v2.0.2
I am attempting to use the following lines of code to produce a histogram of the height data from a diabetes dataset with height values on the x-axis. Unfortunately, it seems that my "just_height" variable is being stored as a vector of integers rather than a dataframe. The code functions properly when I attempt to extract multiple columns of data using a vector of two or more column names (e.g., c("height", "weight)). Is there a better way to extract a single column of data from a dataframe and save it as a separate dataframe?
library(tidyverse)

diabetes <- read.csv("https://raw.githubusercontent.com/malcolmbarrett/au-stats412-612-01-reading_data/master/diabetes.csv")
just_height <- diabetes[, "height"]
ggplot(just_height, aes(x = height)) +
  geom_histogram()
#> Error in `fortify()`:
#> ! `data` must be a data frame, or other object coercible by `fortify()`, not an integer vector.

#> Backtrace:
#>     ▆
#>  1. ├─ggplot2::ggplot(just_height, aes(x = height))
#>  2. └─ggplot2:::ggplot.default(just_height, aes(x = height))
#>  3.   ├─ggplot2::fortify(data, ...)
#>  4.   └─ggplot2:::fortify.default(data, ...)
#>  5.     └─rlang::abort(msg)
Created on 2022-11-29 with reprex v2.0.2
Question: I am trying to create a histogram of the height variable, and I have installed the tidyverse package. So, I am not sure why I am unable to find the function “ggplot”?
diabetes <- read.csv("https://raw.githubusercontent.com/malcolmbarrett/au-stats412-612-01-reading_data/master/diabetes.csv")
just_height <- diabetes[, "height"]
ggplot(na.omit(just_height), aes(x = height)) +
  geom_histogram(bins=30)
#> Error in ggplot(na.omit(just_height), aes(x = height)): could not find function "ggplot"
Conclusion: I want to make a histogram displaying the diabetes data but I received the following: Error in ggplot(na.omit(just_height), aes(x = height)) : could not find function "ggplot". The underlying issue is that read.csv() returns a regular data frame. When I tried to subset a single column in a data frame, R converted the object into a vector instead of a data frame. ggplot() expects a data frame, not a vector. To solve this, I could have set drop = false to keep the value as a data frame.
Hello, I'm have some trouble making a histogram with my dataset, "diabetes". I have filtered the data by just the height variable to include in my ggplot. Unfortunately, I get the fortify() error shown below. I believe this may be because this has created an integer vector instead of a data frame due to the 'data' not being in the arguments, but I'm not sure how to fix it. Any suggestions would be greatly appreciated!
library(tidyverse)
library(ggplot2)
diabetes <- read.csv("https://raw.githubusercontent.com/malcolmbarrett/au-stats412-612-01-reading_data/master/diabetes.csv")
just_height <- diabetes[, "height"]
ggplot(just_height, aes(x = height)) +
  geom_histogram()
#> Error in `fortify()`:
#> ! `data` must be a data frame, or other object coercible by `fortify()`, not an integer vector.

#> Backtrace:
#>     ▆
#>  1. ├─ggplot2::ggplot(just_height, aes(x = height))
#>  2. └─ggplot2:::ggplot.default(just_height, aes(x = height))
#>  3.   ├─ggplot2::fortify(data, ...)
#>  4.   └─ggplot2:::fortify.default(data, ...)
#>  5.     └─rlang::abort(msg)
Created on 2022-11-30 with reprex v2.0.2
Hi everyone! I am currently working in the tidyverse in R to read in the data from a set called diabetes. One of the factors I am trying to analyze within the dataset is the different heights of those in the diabetes dataset, so I tried to filter the data to only include the height. I wanted to filter the data to only include height, and then plot it using a histogram. However, I am running into an issue where I keep getting an error telling me that the data is not a dataframe. If anyone has run into their error before or has any ideas on how I can filter my data and plot it successfully, I would really appreciate it, thanks!
library(tidyverse)
diabetes <- read.csv("https://raw.githubusercontent.com/malcolmbarrett/au-stats412-612-01-reading_data/master/diabetes.csv")
just_height <- diabetes[, "height"]
ggplot(just_height, aes(x = height)) +
  geom_histogram()
#> Error in `fortify()`:
#> ! `data` must be a data frame, or other object coercible by `fortify()`, not an integer vector.

#> Backtrace:
#>     ▆
#>  1. ├─ggplot2::ggplot(just_height, aes(x = height))
#>  2. └─ggplot2:::ggplot.default(just_height, aes(x = height))
#>  3.   ├─ggplot2::fortify(data, ...)
#>  4.   └─ggplot2:::fortify.default(data, ...)
#>  5.     └─rlang::abort(msg)
Created on 2022-11-28 with reprex v2.0.2
What I want to do is create a histogram using data from the diabetes data set but only with the height column and with height on the x axis using the ggplot package. However, the "just_height" is not a dataset, rather a set of values. As a result, the ggplot can't be created. How exactly can I filter the diabetes dataset to only use the height column in a way that creates a usable dataset rather than a set of values that can't be used to created a ggplot?
-Joel Schoenberg
library(tidyverse)
diabetes <- read.csv("https://raw.githubusercontent.com/malcolmbarrett/au-stats412-612-01-reading_data/master/diabetes.csv")
just_height <- diabetes[, "height"]
ggplot(just_height, aes(x = height)) +
  geom_histogram()
#> Error in `fortify()`:
#> ! `data` must be a data frame, or other object coercible by `fortify()`, not an integer vector.

#> Backtrace:
#>     ▆
#>  1. ├─ggplot2::ggplot(just_height, aes(x = height))
#>  2. └─ggplot2:::ggplot.default(just_height, aes(x = height))
#>  3.   ├─ggplot2::fortify(data, ...)
#>  4.   └─ggplot2:::fortify.default(data, ...)
#>  5.     └─rlang::abort(msg)
Created on 2022-12-01 with reprex v2.0.2
Hi all! I am currently trying to work on this code below and need some help. I am initially trying to produce a histogram, with the ggplot package, using the diabetes data I read in. I specifically want to use height data from the diabetes data set and set it as my x-axis. However, It seems that the "just_height" variable is being stored as a vector of integers and not a data frame. This results in an error, not allowing there to be ggplot result. Does anyone have any suggestions on what I can do differently? Thanks!
library(tidyverse)
diabetes <- read.csv("https://raw.githubusercontent.com/malcolmbarrett/au-stats412-612-01-reading_data/master/diabetes.csv")
just_height <- diabetes[, "height"]
ggplot(just_height, aes(x = height)) +
  geom_histogram()
#> Error in `fortify()`:
#> ! `data` must be a <data.frame>, or an object coercible by `fortify()`,
#>   not an integer vector.

#> Backtrace:
#>     ▆
#>  1. ├─ggplot2::ggplot(just_height, aes(x = height))
#>  2. └─ggplot2:::ggplot.default(just_height, aes(x = height))
#>  3.   ├─ggplot2::fortify(data, ...)
#>  4.   └─ggplot2:::fortify.default(data, ...)
#>  5.     └─cli::cli_abort(msg)
#>  6.       └─rlang::abort(...)
Created on 2022-12-01 with reprex v2.0.2
Hi everyone, I'm currently working with this diabetes dataset.
I'm trying to create a new data set from it with just the "height" variable and call that dataset "just_height."
Then use it to make a histogram in ggplot2.
I want the x-axis to be the "height" while the y-axis to be the related count.
When I run my code I get this "Error in 'fortify()':" message.
Does anyone know whats causing this problem?
library(tidyverse)
diabetes <- read.csv("https://raw.githubusercontent.com/malcolmbarrett/au-stats412-612-01-reading_data/master/diabetes.csv")
just_height <- diabetes[, "height"]
ggplot(just_height, aes(x = height)) +
  geom_histogram()
#> Error in `fortify()`:
#> ! `data` must be a data frame, or other object coercible by `fortify()`, not an integer vector.

#> Backtrace:
#>     ▆
#>  1. ├─ggplot2::ggplot(just_height, aes(x = height))
#>  2. └─ggplot2:::ggplot.default(just_height, aes(x = height))
#>  3.   ├─ggplot2::fortify(data, ...)
#>  4.   └─ggplot2:::fortify.default(data, ...)
#>  5.     └─rlang::abort(msg)
Created on 2022-12-03 with reprex v2.0.2
Thanks, everyone, for attempting reprexes, and welcome to RStudio Community!
Now, to fix the code!
First, a few of you missed an important detail: you didn't load ggplot2, so the error you got was about how R couldn't find that function. Remember, reprex runs R in a completely fresh session, so even if you've loaded a package in RStudio, it won't be available unless you include library() in your reprex code.
Technically, we could also make this example more minimal. The problem is not actually with the diabetes dataset, so we could use a built-in dataset to show the problem. However, our example is still reproducible (since the data is on GitHub and the code does read it correctly). Since you may not be sure if it's the data or code that's the problem, it's reasonable to include that dataset.
It turns out that the real issue is a quirk of base R. read.csv() returns a regular data frame, and when we try to subset a single column in a data frame, R converts the object to a vector, not a dataframe:
x <- data.frame(a = 1:5)

x
#>   a
#> 1 1
#> 2 2
#> 3 3
#> 4 4
#> 5 5

x[, "a"]
#> [1] 1 2 3 4 5

is.data.frame(x[, "a"])
#> [1] FALSE
ggplot() expects a data frame, not a vector. When you're dealing with base R, the solution is to set drop = FALSE, which keeps x as a data frame.
x[, "a", drop = FALSE]
#>   a
#> 1 1
#> 2 2
#> 3 3
#> 4 4
#> 5 5

is.data.frame(x[, "a", drop = FALSE])
#> [1] TRUE
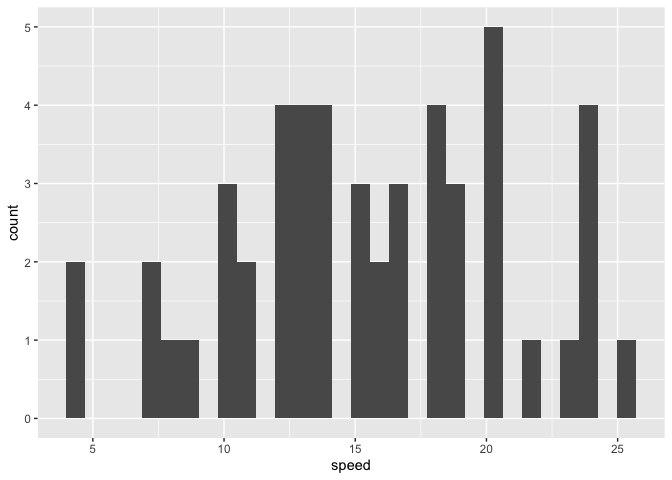
Using this approach will fix our issue. I don't actually need the diabetes dataset here, so instead, I'll use the built-in cars dataset and make a histogram of the speed variable.
library(ggplot2)
just_speed <- cars[, "speed", drop = FALSE]
ggplot(just_speed, aes(x = speed)) +
  geom_histogram()
#> `stat_bin()` using `bins = 30`. Pick better value with `binwidth`.
Notably, the original code used read.csv(), which returns a regular data frame, but readr::read_csv() returns a tibble, a special case of the data frame. Tibbles don't have this behavior, and subsetting them always returns a tibble. We don't need drop = FALSE:
library(tidyverse)
y <- tibble(a = 1:5)
y[, "a"]
#> # A tibble: 5 x 1
#>       a
#>   <int>
#> 1     1
#> 2     2
#> 3     3
#> 4     4
#> 5     5
Using a tibble also solves our problem:
library(tidyverse)
cars <- as_tibble(cars)
just_speed <- cars[, "speed"]
ggplot(just_speed, aes(x = speed)) +
  geom_histogram()
#> `stat_bin()` using `bins = 30`. Pick better value with `binwidth`.
This topic was automatically closed 7 days after the last reply. New replies are no longer allowed.
If you have a query related to it or one of the replies, start a new topic and refer back with a link.