Hi,
I'm trying to thicken my panel axis lines in my standard publishing graph
line = element_line(colour = "black", size = line.n.ticks),
using line inheritance, even though the left y and bottom x lines thicken tha is not the case to the rest or their tick marks.
Below my custom defined theme. ( If you don't want to install extrafonts comment 2nd line. font family is defined as arial in the following reproducible example:
Thanks!
library(tidyverse)
library(extrafont)
#> Warning: package 'tidyverse' was built under R version 3.4.4
#> Warning: package 'ggplot2' was built under R version 3.4.4
#> Warning: package 'tidyr' was built under R version 3.4.4
#> Warning: package 'readr' was built under R version 3.4.4
#> Warning: package 'purrr' was built under R version 3.4.4
#> Warning: package 'forcats' was built under R version 3.4.4
#> Warning: package 'extrafont' was built under R version 3.4.4
#> Registering fonts with R
# loadfonts()
choose.font.family = "Arial"
theme_thesis <- function (choose.font.family, axis.text, axis.title.text, strip.wrap.size ) {
line.n.ticks = 1.0
theme_bw() +
theme(panel.grid.major = element_blank(),
panel.grid.minor = element_blank(),
line = element_line(colour = "black", size = line.n.ticks),
axis.line.x = element_line(colour = "black", size = line.n.ticks),
axis.line.x.bottom = element_line(colour = "black", size = line.n.ticks),
axis.line.x.top = element_line(colour = "black", size = line.n.ticks),
axis.line.y = element_line(colour = "black", size = line.n.ticks),
axis.line.y.left = element_line(colour = "black", size = line.n.ticks),
axis.line.y.right =element_line(colour = "black", size = line.n.ticks),
axis.ticks = element_line(colour = "black", size = line.n.ticks),
title = element_text(size = 20, family = choose.font.family, colour = "black"),
plot.title = element_text(hjust = 0.5),
legend.position="bottom",
legend.key.width=unit(2.2, "cm"),
legend.box= "vertical",
legend.text=element_text(size=axis.title.text, family = choose.font.family, colour = "black"),
legend.title = element_text(size = axis.title.text, family = choose.font.family, colour = "black"),
axis.title.x=element_text(size = axis.title.text, family = choose.font.family, colour = "black" ),
axis.title.y=element_text(size = axis.title.text, family = choose.font.family, colour = "black" ),
axis.text.x = element_text(size = axis.text, family = choose.font.family, colour = "black", margin = margin(t = 0, r = 0, b = 7, l = 0)),
axis.text.y = element_text(size = axis.text, family = choose.font.family, colour = "black", margin = margin(t = 0, r =0, b = 0, l = 7) ),
axis.line = element_line(colour = "black"),
strip.text = element_text(size = strip.wrap.size, family = choose.font.family, colour = "black"))
}
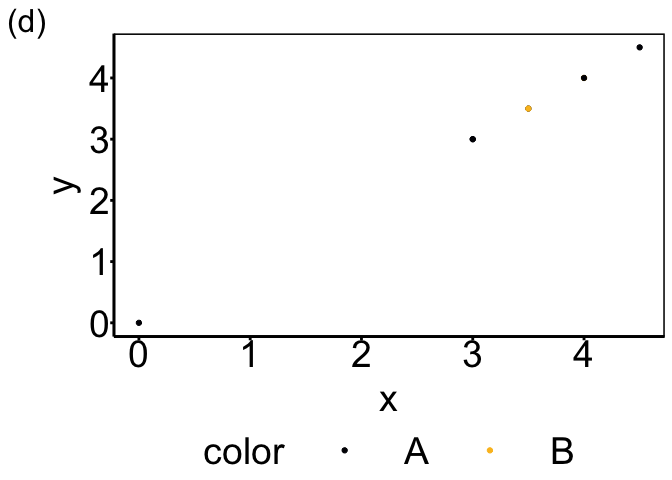
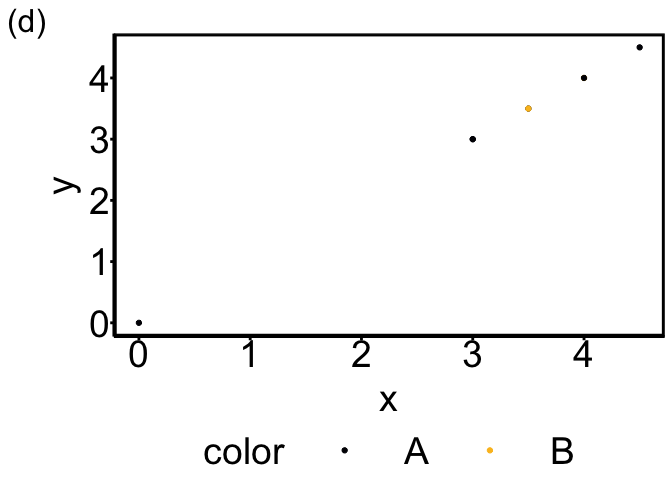
# Plot a random thing
reprex.data <- data.frame(x = c(4.5, 3, 3, 3.5, 3.5, 4, 4, 0), y = c(4.5, 3, 3, 3.5, 3.5, 4, 4, 0), color = c("A", "A", "A", "A", "B", "B", "A", "A"))
ggplot(reprex.data, aes(x = x, y = y, colour = color)) +
geom_point() +
scale_color_viridis_d(option = "B", begin = 0.0, end = 0.85, direction = 1) +
labs(tag = "(d)")+
theme_thesis(choose.font.family, axis.text = 28, axis.title.text = 28, strip.wrap.size = 28)