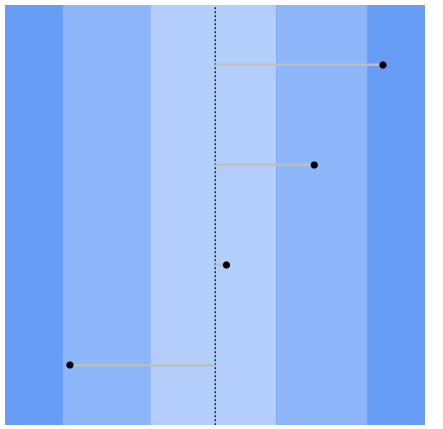
I'm trying to add some text annotations to this plot:
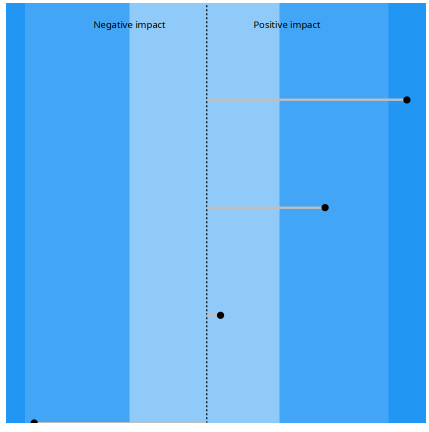
On the top I want to add "Negative impact" and "Positive impact" to the left and right of 0.5 respectively,
and on the bottom c("Very Unlikely", "Unlikely", "About as likely as not", "Likely", "Very Likely") for the respective areas. All these annotations should be outside the colored areas.
This is the code that I have, but is not doing anything close to what I want:
fake_data <- tibble(y = c("y1", "y2", "y3", "y4"),
                    x = c(0.12, 0.53, 0.76, 0.94))

likelihood_areas <- tibble(
  xmin = c(-Inf, 0.1, 0.33, 0.66, 0.9),
  xmax = c(0.1, 0.33, 0.66, 0.9, Inf),
  ymin = rep(-Inf, 5),
  ymax = rep(Inf, 5),
  likelihood = c("Very Unlikely", "Unlikely", "About as likely as not", "Likely", "Very Likely"),
  color = c("#2196f3", "#42a5f5", "#90caf9", "#42a5f5", "#2196f3")
)

ggplot() +
  geom_rect(data = likelihood_areas, aes(xmin = xmin, xmax = xmax, ymin = ymin, ymax = ymax, fill = color)) +
  geom_vline(xintercept = 0.5, linetype = "dashed") +
  geom_segment(data = fake_data, x = 0.5, aes(xend = x, y = y, yend = y), color = "grey", size = 1) +
  geom_point(data = fake_data, aes(x = x, y = y), size = 3) +
  scale_fill_identity() +
  theme_void() +
  scale_y_discrete(expand = expansion(mult = c(0, 0.3))) +
  # Add text annotations
  annotate("text", x = 0.25, y = 4.7, label = "Negative impact", hjust = 0) +
  annotate("text", x = 0.75, y = 4.7, label = "Positive impact", hjust = 1)
What am I missing? Thanks!