Hi all,
Suppose i have the following fictional df:
df <- data.frame(
Company = rep(LETTERS[1:10], each = 10),
Year = rep(2010:2019, times = 10),
Var1 = runif(100, -1, 1),
Var2 = runif(100, -1, 1),
Var3 = runif(100, -1, 1),
Var4 = runif(100, -1, 1),
Var5 = runif(100, -1, 1)
)
summary(ls1 <- lm(Var1 ~ Var2 + Var3 + Var4 + Var5, data=df))
I want to test whether the coefficient of Var 3 significantly is different from zero at significance level of pvalue of 0.01 , or if it not (so equal to 0). If it is different from zero, i would like to know whether the coefficient is then > 0 or < 0.
Moreover, i want to test whether also whether the coefficient of Var5 bigger or smaller than the coefficient of Var4 at a level of 0.01, or whether the coefficient of Var5 does not differ significantly from the coefficient from Var4 (so Var5 = Var4 at significance level of P value < 0.01).
Any help would be highly appreciated. I am still new to R so i do not understand this completely.
The first question is easy. You want a "one-tailed" test rather than a "two-tailed" test. For example, if you want the one-tailed critical value at the 5 percent level with 95 degrees of freedom use qt(0.05,1000).
To test hypotheses involving multiple coefficients take a look at linearhypothesis in the car package. Some guidance is given at Linear Hypothesis Tests | LOST
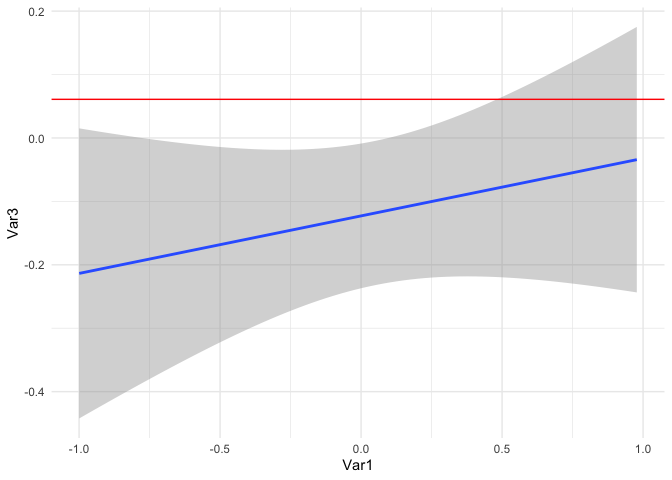
How do you understand the meaning of a coefficient of a variable set as an independent variable in linear regression? Visualize the model.
# for reproducibility; otherwise each time
# data frame is generated, values are very
# likely to differ
set.seed(42)
d <- data.frame(
  Company = rep(LETTERS[1:10], each = 10),
  Year = rep(2010:2019, times = 10),
  Var1 = runif(100, -1, 1),
  Var2 = runif(100, -1, 1),
  Var3 = runif(100, -1, 1),
  Var4 = runif(100, -1, 1),
  Var5 = runif(100, -1, 1)
)

# simplify for illustration

fit <- lm(Var1 ~ Var3, data = d)
summary(fit)
#>
#> Call:
#> lm(formula = Var1 ~ Var3, data = d)
#>
#> Residuals:
#>      Min       1Q   Median       3Q      Max
#> -1.15316 -0.56749 -0.01864  0.49949  0.98071
#>
#> Coefficients:
#>             Estimate Std. Error t value Pr(>|t|)
#> (Intercept)  0.06090    0.06171   0.987    0.326
#> Var3         0.10085    0.10602   0.951    0.344
#>
#> Residual standard error: 0.6042 on 98 degrees of freedom
#> Multiple R-squared:  0.009147,   Adjusted R-squared:  -0.0009637
#> F-statistic: 0.9047 on 1 and 98 DF,  p-value: 0.3439
# visualize
library(ggplot2)
ggplot(d,aes(Var1,Var3)) +
  geom_smooth(method = "lm") +
  theme_minimal() +
  geom_hline(yintercept = coef(fit)[1], color = "red")
#> `geom_smooth()` using formula = 'y ~ x'
Created on 2023-05-30 with reprex v2.0.2
What part of the plot represents the coefficient? What part represents a coefficient of zero? Is there a difference? What would cause someone to doubt that the difference was not simply the result of random variation?