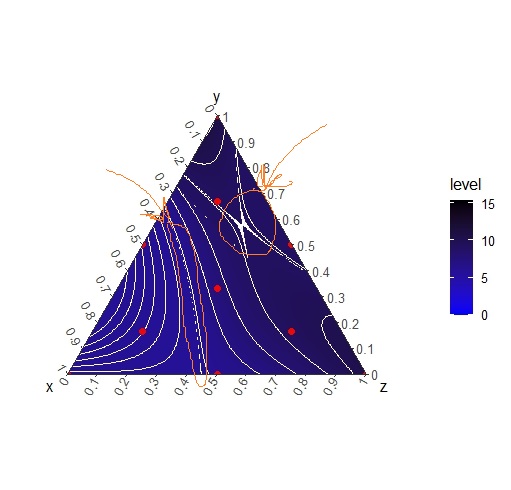
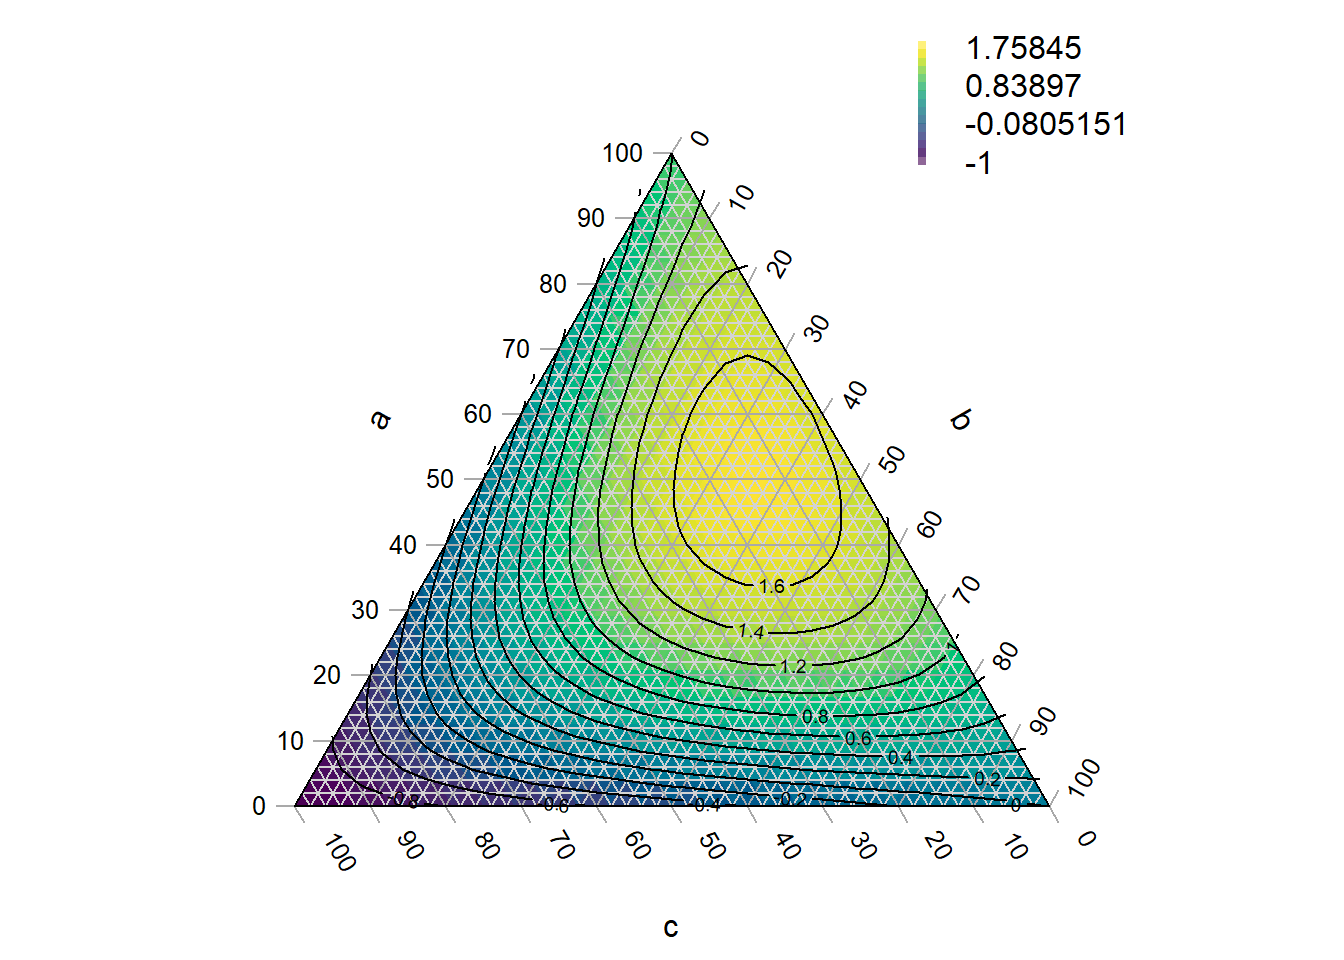
Hello. I have a data for ternary plot. Unfortunately I don't understand how to add colors between contours and values of contours. This is example what I want. And I hope it can do in ggtern.
| x1 | x2 | x3 | y |
|---|---|---|---|
| 10,00 | 0,00 | 0,00 | 5,74 |
| 10,00 | 0,00 | 0,00 | 4,23 |
| 10,00 | 0,00 | 0,00 | 8,78 |
| 10,00 | 0,00 | 0,00 | 5,58 |
| 10,00 | 0,00 | 0,00 | 4,14 |
| 10,00 | 0,00 | 0,00 | 4,63 |
| 10,00 | 0,00 | 0,00 | 5,70 |
| 10,00 | 0,00 | 0,00 | 4,77 |
| 0,00 | 10,00 | 0,00 | 10,49 |
| 0,00 | 10,00 | 0,00 | 11,26 |
| 0,00 | 10,00 | 0,00 | 8,47 |
| 0,00 | 10,00 | 0,00 | 9,88 |
| 0,00 | 10,00 | 0,00 | 9,55 |
| 0,00 | 10,00 | 0,00 | 7,98 |
| 0,00 | 10,00 | 0,00 | 8,81 |
| 0,00 | 10,00 | 0,00 | 11,51 |
| 0,00 | 0,00 | 10,00 | 11,80 |
| 0,00 | 0,00 | 10,00 | 11,03 |
| 0,00 | 0,00 | 10,00 | 8,98 |
| 0,00 | 0,00 | 10,00 | 13,00 |
| 0,00 | 0,00 | 10,00 | 12,94 |
| 0,00 | 0,00 | 10,00 | 8,59 |
| 0,00 | 0,00 | 10,00 | 13,35 |
| 0,00 | 0,00 | 10,00 | 10,74 |
| 3,33 | 3,33 | 3,33 | 6,99 |
| 3,33 | 3,33 | 3,33 | 5,25 |
| 3,33 | 3,33 | 3,33 | 7,17 |
| 3,33 | 3,33 | 3,33 | 4,99 |
| 3,33 | 3,33 | 3,33 | 6,52 |
| 3,33 | 3,33 | 3,33 | 5,35 |
| 3,33 | 3,33 | 3,33 | 5,07 |
| 3,33 | 3,33 | 3,33 | 6,80 |
| 5,00 | 5,00 | 0,00 | 1,65 |
| 5,00 | 5,00 | 0,00 | 1,52 |
| 5,00 | 5,00 | 0,00 | 1,37 |
| 5,00 | 5,00 | 0,00 | 0,83 |
| 5,00 | 5,00 | 0,00 | 1,17 |
| 5,00 | 5,00 | 0,00 | 0,93 |
| 5,00 | 5,00 | 0,00 | 2,37 |
| 5,00 | 5,00 | 0,00 | 1,69 |
| 0,00 | 5,00 | 5,00 | 10,74 |
| 0,00 | 5,00 | 5,00 | 6,85 |
| 0,00 | 5,00 | 5,00 | 6,60 |
| 0,00 | 5,00 | 5,00 | 11,52 |
| 0,00 | 5,00 | 5,00 | 8,69 |
| 0,00 | 5,00 | 5,00 | 9,83 |
| 0,00 | 5,00 | 5,00 | 8,14 |
| 0,00 | 5,00 | 5,00 | 7,81 |
| 5,00 | 0,00 | 5,00 | 8,75 |
| 5,00 | 0,00 | 5,00 | 8,81 |
| 5,00 | 0,00 | 5,00 | 6,33 |
| 5,00 | 0,00 | 5,00 | 7,61 |
| 5,00 | 0,00 | 5,00 | 7,47 |
| 5,00 | 0,00 | 5,00 | 5,62 |
| 5,00 | 0,00 | 5,00 | 8,24 |
| 5,00 | 0,00 | 5,00 | 6,20 |
| 1,66 | 6,66 | 1,66 | 15,40 |
| 1,66 | 6,66 | 1,66 | 13,68 |
| 1,66 | 6,66 | 1,66 | 11,08 |
| 1,66 | 6,66 | 1,66 | 13,03 |
| 1,66 | 6,66 | 1,66 | 10,97 |
| 1,66 | 6,66 | 1,66 | 13,64 |
| 1,66 | 6,66 | 1,66 | 10,63 |
| 1,66 | 6,66 | 1,66 | 10,81 |
| 6,66 | 1,66 | 1,66 | 2,60 |
| 6,66 | 1,66 | 1,66 | 5,14 |
| 6,66 | 1,66 | 1,66 | 3,71 |
| 6,66 | 1,66 | 1,66 | 3,33 |
| 6,66 | 1,66 | 1,66 | 2,76 |
| 6,66 | 1,66 | 1,66 | 3,34 |
| 6,66 | 1,66 | 1,66 | 2,61 |
| 6,66 | 1,66 | 1,66 | 2,91 |
| 1,66 | 1,66 | 6,66 | 6,69 |
| 1,66 | 1,66 | 6,66 | 8,03 |
| 1,66 | 1,66 | 6,66 | 7,45 |
| 1,66 | 1,66 | 6,66 | 5,98 |
| 1,66 | 1,66 | 6,66 | 7,27 |
| 1,66 | 1,66 | 6,66 | 5,79 |
| 1,66 | 1,66 | 6,66 | 7,16 |
| 1,66 | 1,66 | 6,66 | 6,16 |
This is my code
dr <- htr%>%rename("x"="x1","y"="x2","z"="x3","d"="y")

ggtern(dr,aes(x=x,z=y,y=z,value=d)) + geom_point(aes(col=d),size=2)+
  geom_interpolate_tern(data = dr,mapping = aes(x=x,z=z,y=y,value=d,col=..level..),
                        method = 'lm',
                        formula = value ~ -1+x+y+I(1-x-y)+x:y+x:I(1-x-y)+y:I(1-x-y)+x:y:I(1-x-y),
                        base='identity')+
  scale_fill_gradient(low = "green", high = "red")+
  scale_L_continuous(breaks = 0:10 / 10, labels = 0:10 / 10) +
  scale_R_continuous(breaks = 0:10 / 10, labels =0:10 / 10) +
  scale_T_continuous(breaks = 0:10 / 10, labels = 0:10 / 10)+theme_bw()
I got message:
Warning message:
The following aesthetics were dropped during statistical transformation: value
![]() This can happen when ggplot fails to infer the correct grouping structure in the data.
This can happen when ggplot fails to infer the correct grouping structure in the data.
![]() Did you forget to specify a
Did you forget to specify a group aesthetic or to convert a numerical variable into a factor?
I think that I need grouping my data. But I don't know how it help me(
Perhaps someone knows how to do this in the ternary package. Thanks for any advice.