Hello everyone, I am currently working on the package "gtsummary" and use its function tbl_summary to create descriptive statistics table. I want to add a 95% CI of mean to the table and according to this article FAQ + Gallery • gtsummary I should add the function "ll" and "ul"
This is my code:
ll <- function(x) t.test(x)$conf.int[[1]] # Lower 95% CI of mean
ul <- function(x) t.test(x)$conf.int[[2]] # Upper 95% CI of mean

# create table 1
table <- df() %>% select(input$indStat,input$depStat) %>%
        tbl_summary(by=input$indStat,type=all_continuous()~"continuous2",statistic = list(all_continuous()~c("{mean}","{sd}","{ll}","{ul}","{median}", "{p25} , {p75}","{min} , {max}")),missing="no",digits = all_continuous() ~ 3)
however, it shows an error as follows:
Warning: Error in : Problem with mutate() input df_stats.
x Problem with mutate() input value.
x could not find function "ll"
i Input value is purrr::map2_dbl(...).
i Input df_stats is pmap(...).
129:
I am creating a shiny web app and anyone has idea how to solve this one? I dont understand why it has something to do with mutate() function and why it could not find function "ll". Thank you so much!
That works when I run the code in R console, but unfortunately when I try to put it in the R Shiny Script it shows the error. So the problem apparently located on the function "ll" and "ul", somehow if I put it in the R Shiny script within the server, it can not read the function and gives the error that "x could not find function ll". But when I remove the ll and ul from gtsummary table, it works fine. Here is example in shiny code:
library(gtsummary)
library(gt)
library(dplyr)
ui <- fluidPage(
titlePanel("Hello Shiny!"),
sidebarLayout(
sidebarPanel(),
mainPanel(
gt_output("tblsummary"),
) )
)
# Define server logic required to draw a histogram ----
server <- function(input, output) {
output$tblsummary <- render_gt({
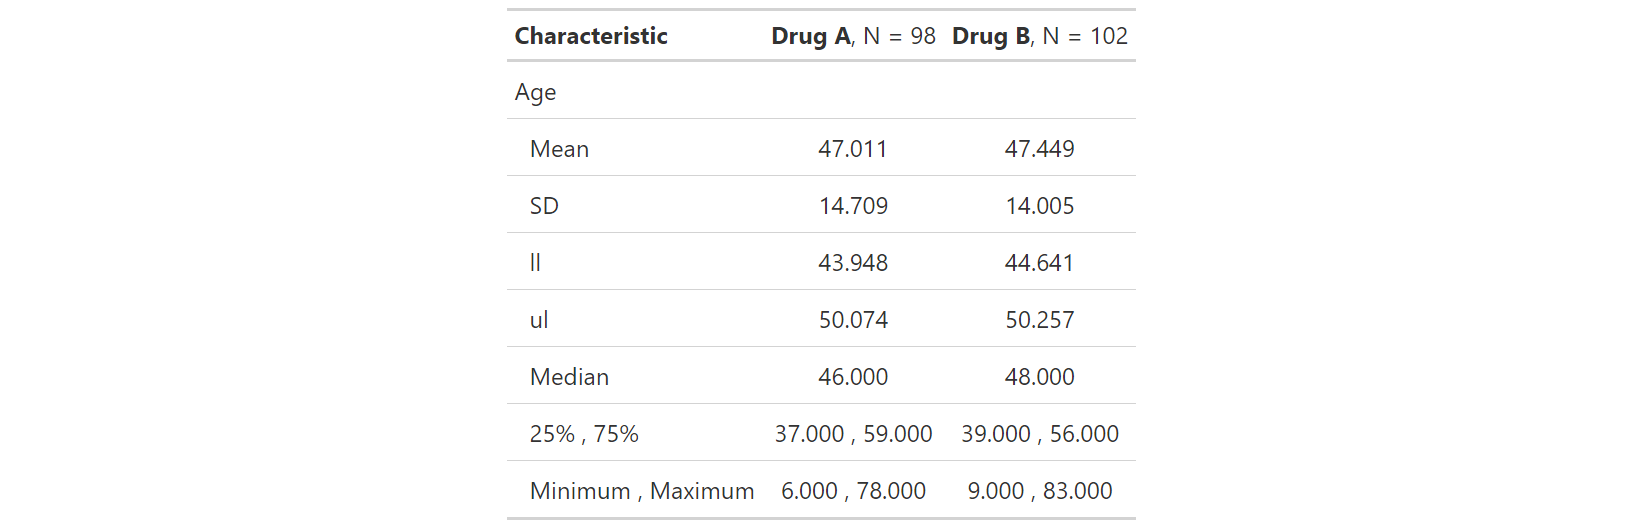
ll <- function(x) t.test(x)$conf.int[[1]] # Lower 95% CI of mean
ul <- function(x) t.test(x)$conf.int[[2]] # Upper 95% CI of mean
# create table 1
table <-
trial %>%
select(trt, age) %>%
tbl_summary(
by = trt,
type = all_continuous() ~ "continuous2",
statistic = all_continuous() ~ c("{mean}", "{sd}", "{ll}", "{ul}", "{median}", "{p25} , {p75}", "{min} , {max}")
) %>% as_gt()
})
}
shinyApp(ui, server)