Takes ages to run lme4

Hi everybody,

I'm new to R, so I apologise in advance if I'm not clear enough or if my question is too naive.

I'm trying to analyse the data from a psycholinguistic study using linear mixed models, and my problem is that it takes hours to run maximal models. R's running and running for hours (even 72), and either nothing happens or I get the 'singular fit' warning. I have three IVs (a 2 x 2 x 3 design) and two DVs (reaction times, and accuracy). There were 35 participants and 40 items per condition.

Can you just tell on the top of their head what the problem might be?

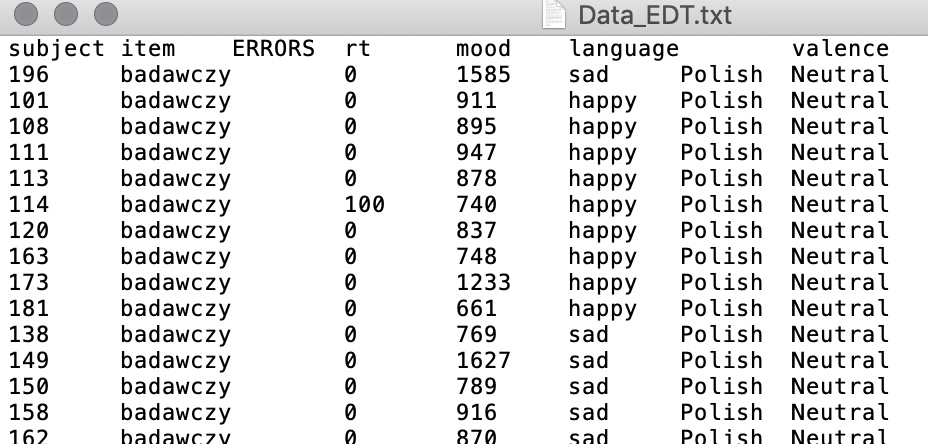
This is how the data is organised in the data file:

First, welcome to the RStudio Community.

Next, it sounds like you understand the statistics of mixed effects models but the lme4 package is not behaving well with you data set. Would you be interested in trying to train the model with a mixed effect random forest approach?

Tree-Based Varying Coefficient Regression for Generalized Linear and Ordinal Mixed Models

Recursive partitioning for varying coefficient generalized linear models and ordinal linear mixed models. Special features are coefficient-wise partitioning, non-varying coefficients and partitioning of time-varying variables in longitudinal regression.

I have not used this package myself. This might help you narrow down whether there is something flawed in the data set if both techniques have problems training on it.

Are you able to make your data public and the code?

I simulated some random data and didnt have any 'performance' issues.

library(lme4)
library(tidyverse)


mydata1 <- 
  expand.grid(
    mood=c("sad","happy"),
    language=c("English","Polish"),
    valence=c("neutral","positive","negative")
  )  
  
set.seed(42)
mydata1$random_mean <-runif(nrow(mydata1),max=10)
mydata1$random_sd <-runif(nrow(mydata1),max=10)

#double it 5times
mydata<-union_all(mydata1,mydata1)
mydata<-union_all(mydata,mydata)

# make probablistic results
mydata<-mutate(mydata,
       Errors = round(pmax(rnorm(random_mean,random_sd),0),digits = 0),
       rt = round(pmax(rnorm(random_mean,random_sd),0),digits = 2)*500) %>% 
  select(-random_mean,random_sd)

mod1<-lme4::lmer(formula=
                   Errors ~  valence + language   | mood  ,
                 data = mydata)

mydata$prederrors<-predict(mod1,newdata=mydata)

to_plot <- mydata %>% mutate(moodlanguage=paste0(mood,language)) %>% 
  select(moodlanguage,valence,Errors,prederrors)
to_plot <- pivot_longer(to_plot,
                        cols= c("Errors","prederrors"),
                        names_to="category",
                        values_to="value")
ggplot(to_plot,
       mapping = aes(x=moodlanguage,y=value,color=valence,shape=category)) +
  geom_point() + facet_wrap(~category)

This topic was automatically closed 21 days after the last reply. New replies are no longer allowed.