This is either a niche question or I haven't worked out the terminology to generate useful google search results...
My challenge is that I have some survey data which was originally collected via SPSS. If I had the SPSS file, there would be no issue—{haven} and {labelled} have functions that work for this scenario. As well, there are a few good onlinr resources that provide insights into working with these packages.
Alas, I don't have the SPSS file. What I have instead is an Excel file that I believe was created from SPSS output, and contains:
sheet 1 - the survey responses in a tidy dataframe, with the category values for each variable (eg "region" is coded 1, 2, 3, 4)
sheet 2 - the codebook, which provides the concordance between those values and the labels (1 = "north", 2 = "east", etc)
The codebook is not at all tidy, so I am in search of an example (or a package with the necessary functions) to merge the labels into the dataframe...to reverse-engineer what I would have in my environment if I was able to read the source SPSS file directly.
Below is one way to read in and combine the values from both sheets. If the real challenge is in cleaning the codebook from sheet 2, please supply a subset of the data (if you can).
library(tidyverse)
library(readxl)

responses = read_excel('path_to_your_file.xlsx', sheet = 'Sheet1')
codes = read_excel('path_to_your_file.xlsx', sheet = 'Sheet2')

responses
#> # A tibble: 5 × 1
#>   region
#>    <dbl>
#> 1      2
#> 2      1
#> 3      5
#> 4      4
#> 5      3
codes
#> # A tibble: 5 × 2
#>   region label
#>    <dbl> <chr>
#> 1      1 north
#> 2      2 east
#> 3      3 south
#> 4      4 west
#> 5      5 norhteast

out = left_join(responses, codes)
#> Joining, by = "region"

out
#> # A tibble: 5 × 2
#>   region label
#>    <dbl> <chr>
#> 1      2 east
#> 2      1 north
#> 3      5 norhteast
#> 4      4 west
#> 5      3 south
Hi @scottyd22, thanks for the reply. And also for subtly providing a reminder as to why a minimal reproducible example is important!
Your solution would work for me if the codebook was in a tidy form—it's not. The real challenge is indeed in cleaning the codebook—I am up for that challenge, but wondering if someone else has gone before me, and created a generalized solution.
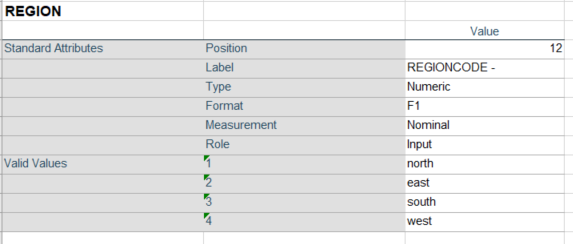
Rather than provide a file with the data, I have attached a screenshot showing how each variable is represented in the codebook. This structure is repeated for every question; it's the categorical variables that need labelling. Plenty of empty rows, etc, and of course the number of "valid values" rows will vary by survey question.
Thanks for sharing! I thought that was probably the case. Another question - does each variable exist in its own sheet, or do the variables show up (stacked) in the same worksheet?