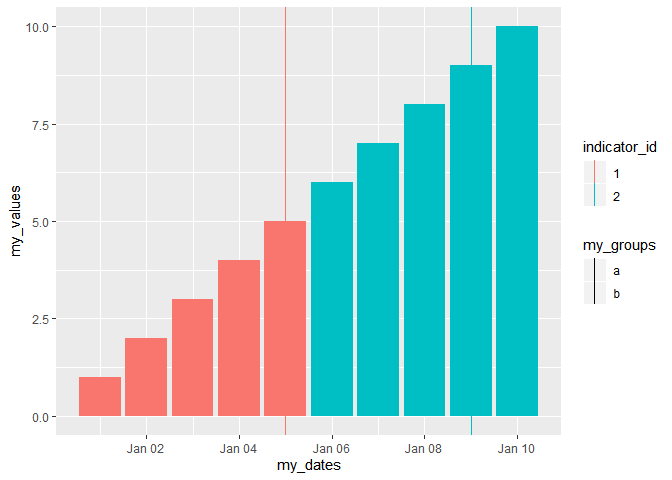
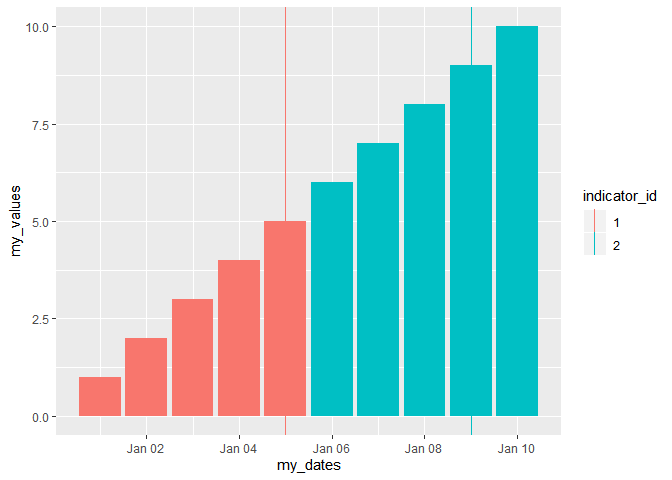
Why are the two plots below not identical? By setting show.legend=F in geom_bar I would expect the related legends (pertaining to the defined aesthetics) not to show up, irrespective of whether I set show.legend to NA or TRUE in another geom. I am aware that I can specify legends also via guides. But I am puzzled by show.legends behavior and would like to understand it better. Thx!
library(tidyverse)

my_df <- tibble(my_dates=seq.Date(from=as.Date("2019/01/01"),
                                          to=as.Date("2019/01/10"),
                                          by="day"),
                my_values=seq(1:10),
                my_groups=rep(c("a","b"), each=5))

my_indicators <- c("2019/01/05", "2019/01/09") %>%
  enframe(., name="indicator_id", value="indicator_dates") %>%
  mutate_at(vars(contains("dates")), as.Date) %>%
  mutate_at(vars(contains("id")), as.character)

my_df %>%
  ggplot()+
  geom_bar(aes(x=my_dates,
               y=my_values,
               fill=my_groups),
           stat="identity",
           show.legend = F)+
  geom_vline(data=my_indicators,
             aes(xintercept=indicator_dates,
                 color=indicator_id),
             show.legend=T)
my_df %>%
  ggplot()+
  geom_bar(aes(x=my_dates,
               y=my_values,
               fill=my_groups),
           stat="identity",
           show.legend = F)+
  geom_vline(data=my_indicators,
             aes(xintercept=indicator_dates,
                 color=indicator_id),
             show.legend = NA)
Created on 2019-09-18 by the reprex package (v0.3.0)