Hello,
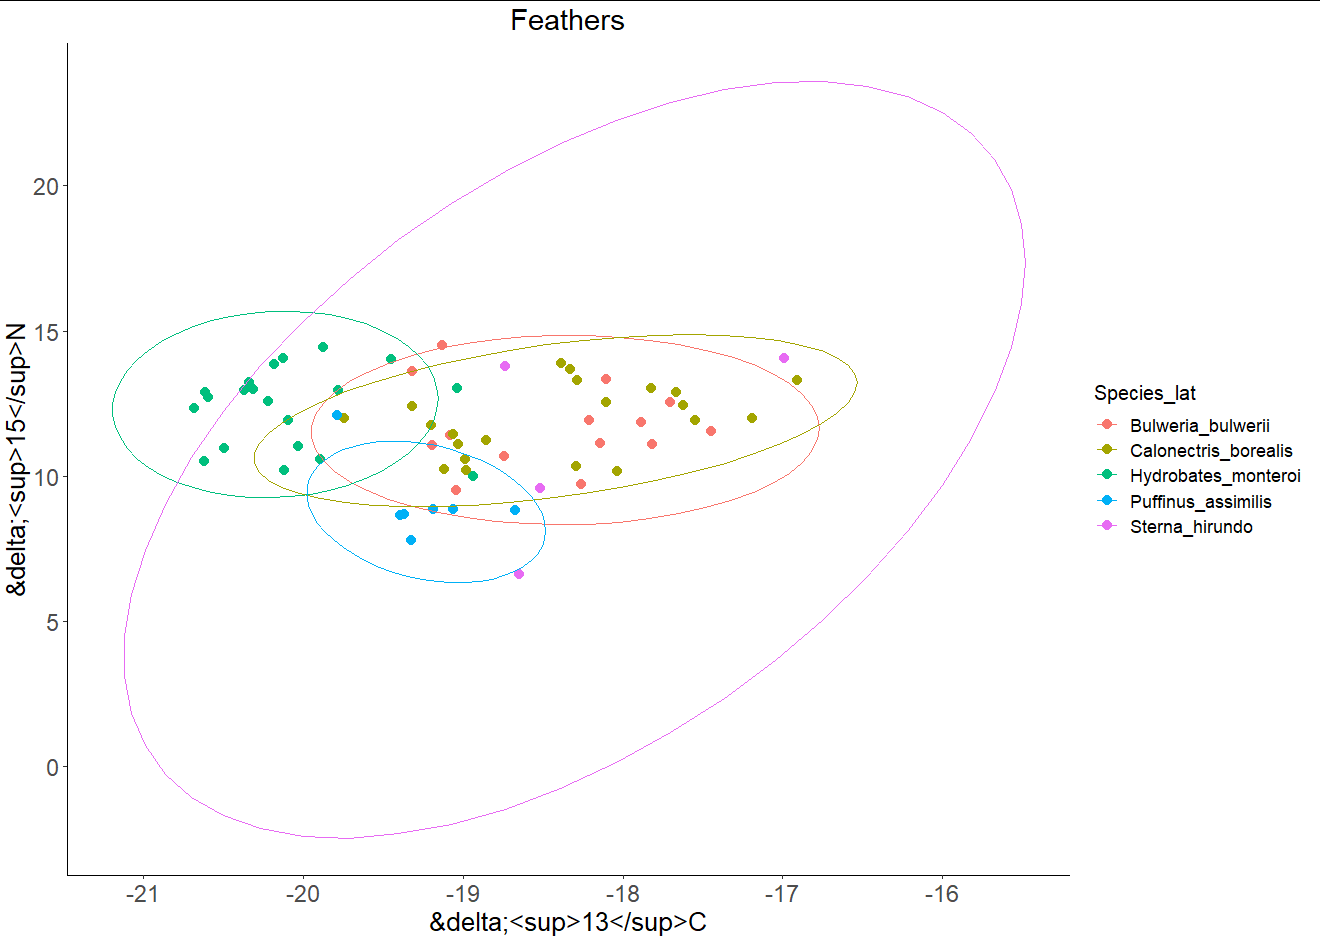
I want to label the axes of my Scatterplots witch δ13C and δ15N, the Number beeing in superscript and yes, before the letters.
I tried it using the ^ but that did not work out. Maybe I am just missing a package or something?
Would be nice to find a solution during this Weekend 
#> Feathers_df <-ggplot(Birdsf, axes = FALSE, aes(x=d13C_df, y=d15N_df, colour=Species_lat, group = Species_lat)) +
  geom_point(size=3) +
  stat_ellipse(level = 0.95) +
  labs(x=expression(paste(delta,"13C")), y=expression(paste(delta,"15N")),
       title="Feathers")
Feathers_df +
  theme_classic()+
  theme(axis.text=element_text(size=16))+
  theme(plot.title = element_text(hjust = 0.5))+
  theme(plot.title = element_text(size = 20))+
  theme(axis.title = element_text(size = 18))+
  theme(legend.text = element_text(size = 12))+
  theme(legend.title = element_text(size = 14))
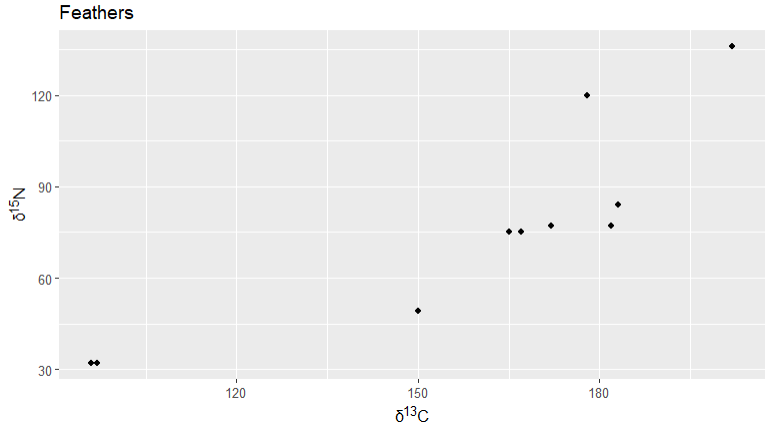
The ggtext package is perfect for this. In the example below, I pulled data from the starwars dataset to create the graph, but the code for labs and theme should be what you need.
library(tidyverse)
library(ggtext)
ggplot(head(starwars, 10), aes(x = height, y = mass)) +
geom_point() +
labs(x = 'δ<sup>13</sup>C',
y = 'δ<sup>15</sup>N',
title = 'Feathers') +
theme(axis.title.x = element_markdown(),
axis.title.y = element_markdown(),
)
I just loaded the packages and copied your code into my skript, but it did not work out like yours. Do you know whre my error is?
#>Feathers_df <-ggplot(Birdsf, axes = FALSE, aes(x=d13C_df, y=d15N_df, colour=Species_lat, group = Species_lat)) +
geom_point(size=3) +
stat_ellipse(level = 0.95) +
labs(x = 'δ<sup>13</sup>C',
y = 'δ<sup>15</sup>N',
title = 'Feathers')
Feathers_df +
theme_classic()+
theme(axis.text=element_text(size=16))+
theme(plot.title = element_text(hjust = 0.5))+
theme(plot.title = element_text(size = 20))+
theme(axis.title = element_text(size = 18))+
theme(legend.text = element_text(size = 12))+
theme(legend.title = element_text(size = 14))
Nevermind, I forgot to copy all of it into my skript, now it works 
Thank you very much!
Do you maybe also know, how i could transform my axes scales, so they show the values in steps of 1? the automatic limits are fine.
Glad it worked out!
For the steps of 1 on each axis, you could try adding the following:
scale_x_continuous(breaks = seq(min(Birdsf$d13C_dfv), max(Birdsf$d13C_df), 1) +
scale_y_continuous(breaks = seq(min(Birdsf$d15N_df), max(Birdsf$d15N_df), 1) +
Again thank you!
It does not look like I hoped it would, but I can work with this script.