Hi all, I am relatively new to R language. I have 1 minute time series data for the stock market in a data table brought in from excel. The table has hundreds of thousands of rows and 6 columns. The columns being the date/time, the open price, the close price, the high price, the low price, and the volume for each 1 minute period. I am wondering if it’s possible to summarize this data into 30 minute periods. The problem I am struggling with is that there are certain periods missing so I need to reference the date/time instead of a fixed recurring range of rows to summarize. If anyone thinks they might be able to help please let me know and I can go more in depth and show the data. Thank you!
Hello @B_elias2 ,
please provide some data that shows your problem in the form of a reprex .
Also show us why the 'standard' idea of rounding at 30 minutes clocktime and summarizing at those equidistant points is insufficient.
1 Like
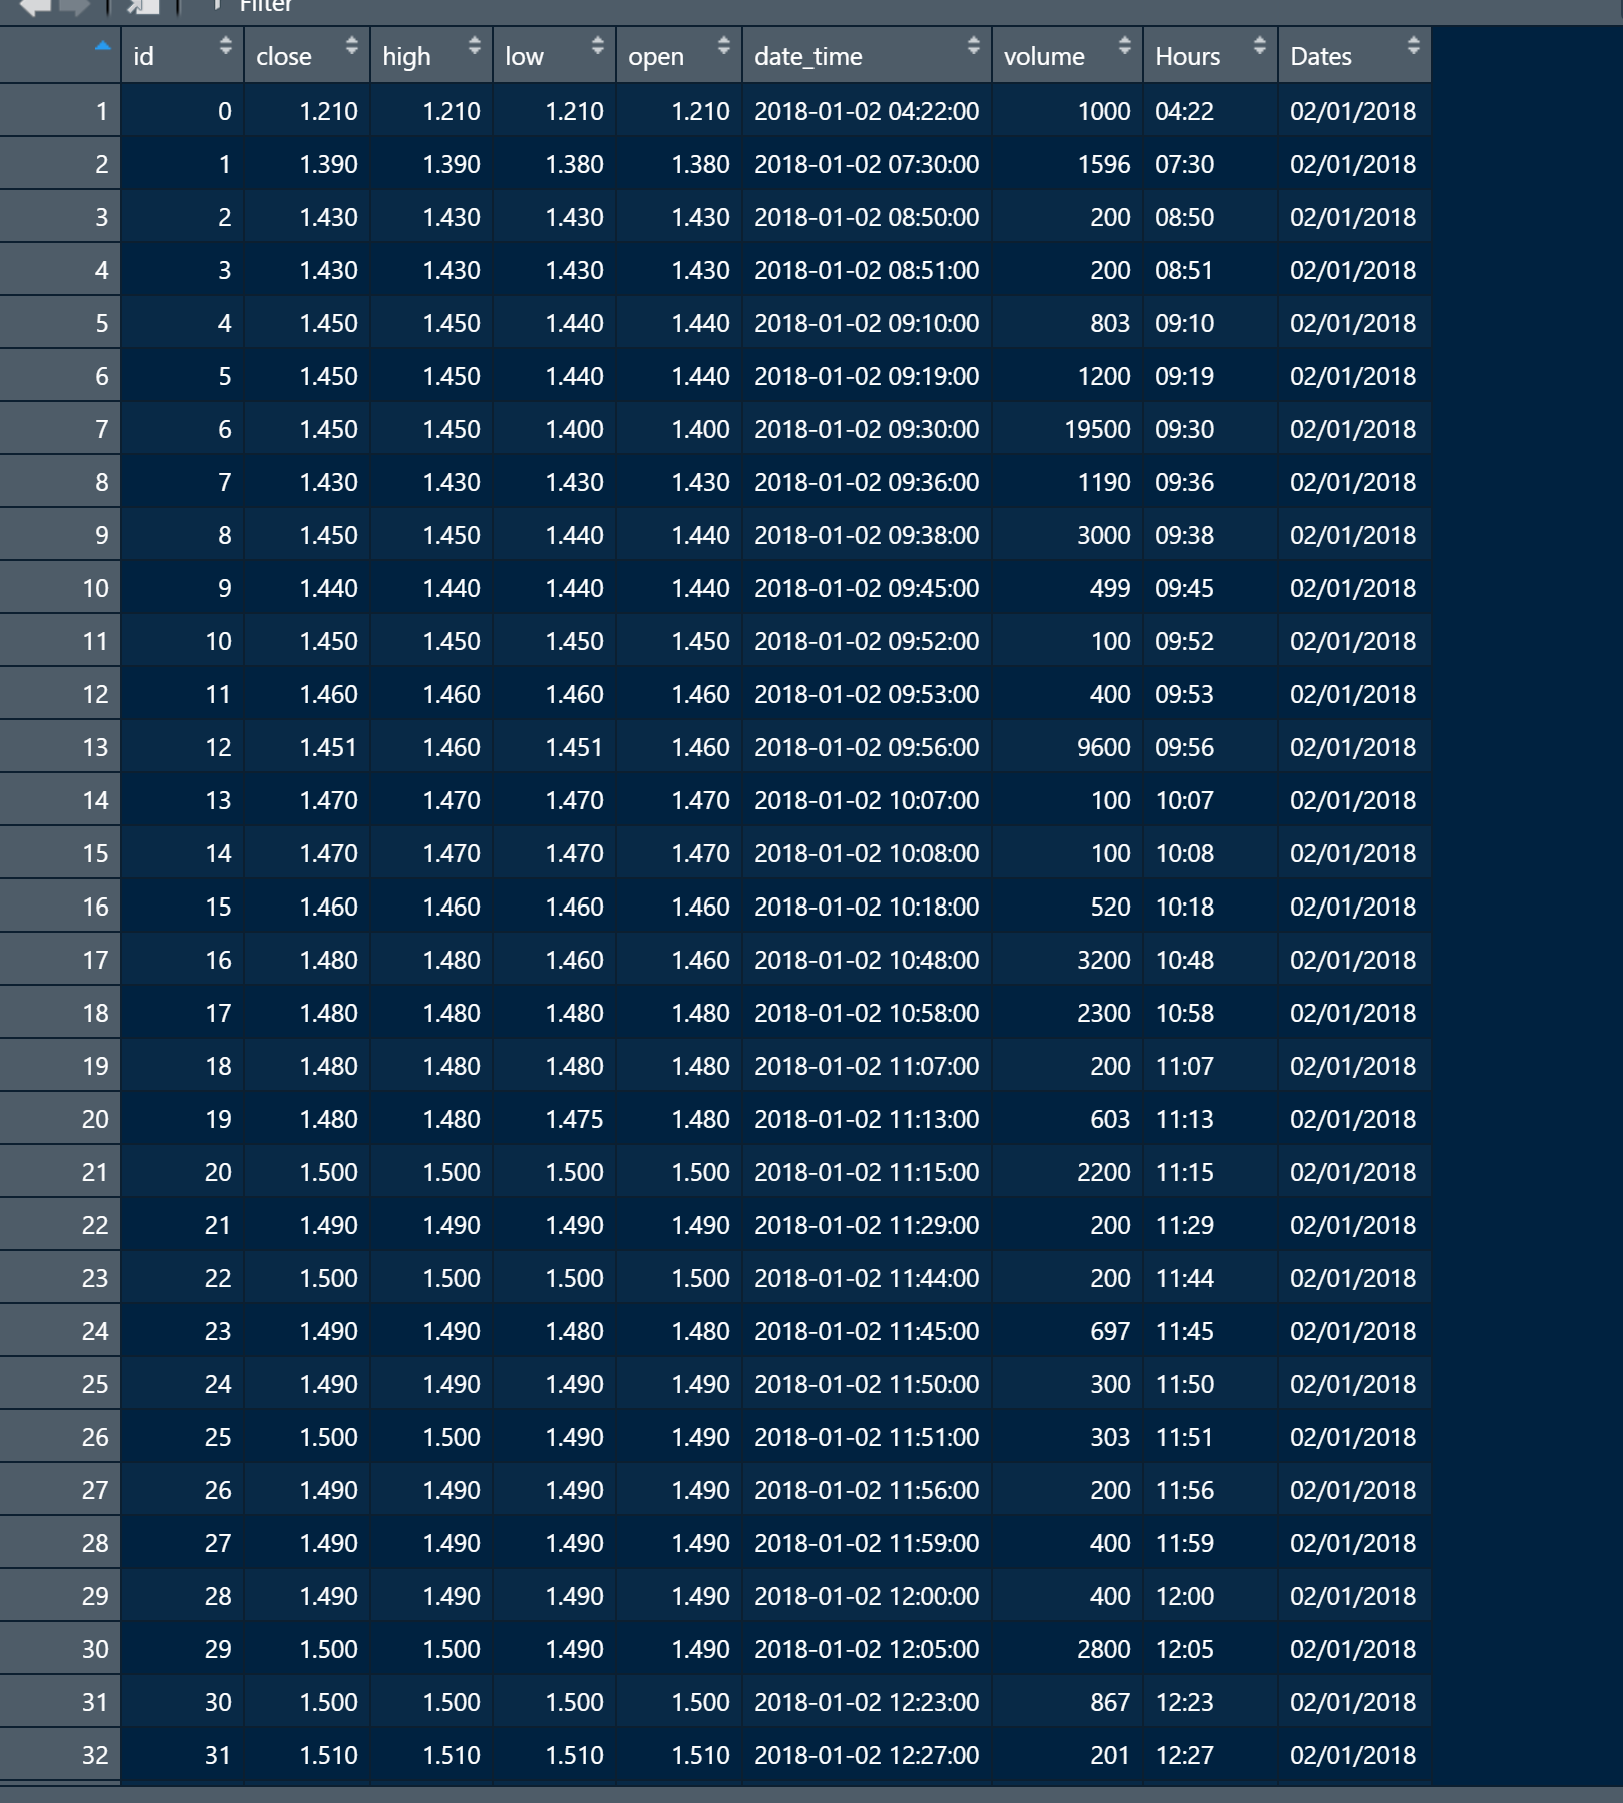
This is a sample image of the data I have, the actual dataset is several hundred thousand rows. Unfortunately, there are missing data points so each of the desired "30 min" periods of data is not equidistant apart. So, I want to create summary statistics of this data based on a 30-minute time frame derived from this data which is in 1-minute increments. Specifically, for each 30 minute period, I want the minimum of the "low" column, the maximum of the "high" column. The first "open" data point of each period represents the opening price of the 30 minute period. Likewise, for the "close" column I want the last closing price data point of the period. And lastly, I want to simply sum the volume column for each 30 minute period. Ultimately, I want to condense this dataset into 30-minute increments and summarize the data within each 30 minute period in the ways described above. I am struggling most with understanding how to tell R to perform these desired actions by the time/date and not a recurring equidistant range of cells. Thank you all! any guidance is appreciated!
Please post the output of
dput(head(DF, 20))
where you replace DF with the name of the data frame that holds your data. Paste the output between lines that consist of three back ticks.
```
Your output here
```
People can then use exactly the same data you are using.
A screenshot is not very useful for people trying to help you since we cant easily copy from that, so I'm going to give a general example of how you can aggregate data by custom time intervals independently of the number of rows that fall into each interval.
library(tidyverse)
library(tibbletime)

# Made up data since you haven't provided sample data in a copy/paste friendly format
sample_df <- data.frame(
    date_time = as.POSIXct(c("2021-08-01 00:02:03 UTC", "2021-08-01 00:14:03 UTC",
                              "2021-08-01 00:35:03 UTC", "2021-08-01 00:47:03 UTC")),
    other_variable_1 = rnorm(4),
    other_variable_2 = rnorm(4)
)

# Example solution
sample_df %>%
    as_tbl_time(date_time) %>%
    collapse_by("30 min", side = "start", clean = TRUE) %>%
    group_by(date_time) %>%
    summarise(across(.fns = last))
#> # A time tibble: 2 × 3
#> # Index: date_time
#>   date_time           other_variable_1 other_variable_2
#>   <dttm>                         <dbl>            <dbl>
#> 1 2021-08-01 00:00:00            0.941            1.43
#> 2 2021-08-01 00:30:00            0.778            0.834
Created on 2021-08-01 by the reprex package (v2.0.0)
If you need more specific help, our an alternative solution, please provide a proper REPRoducible EXample (reprex) illustrating your issue.
1 Like
Borrowing the made up data from andresrcs, another approach using {tsibble} instead of {tibbletime}, and floor_date() from {lubridate} .
library(tsibble)
library(dplyr)
library(lubridate)

sample_df <- data.frame(
  date_time = as.POSIXct(c("2021-08-01 00:02:03 UTC", "2021-08-01 00:14:03 UTC",
                           "2021-08-01 00:35:03 UTC", "2021-08-01 00:47:03 UTC")),
  open = rnorm(4),
  close = rnorm(4)
)

sample_df %>%
  as_tsibble(index = date_time) %>%
  index_by(date_time30 = ~ floor_date(., "30 minute")) %>%
  summarise(open30 = first(open), close30 = last(close))
#> # A tsibble: 2 x 3 [30m] <?>
#>   date_time30         open30 close30
#>   <dttm>               <dbl>   <dbl>
#> 1 2021-08-01 00:00:00 -0.113  0.0822
#> 2 2021-08-01 00:30:00  1.44  -0.0985
Created on 2021-07-31 by the reprex package (v2.0.0)
2 Likes
For this simple case, you could even get away with only lubridate::floor_date()
library(dplyr)
library(lubridate)

# Made up data since you haven't provided sample data in a copy/paste friendly format
sample_df <- data.frame(
    date_time = as.POSIXct(c("2021-08-01 00:02:03 UTC", "2021-08-01 00:14:03 UTC",
                             "2021-08-01 00:35:03 UTC", "2021-08-01 00:47:03 UTC")),
    other_variable_1 = rnorm(4),
    other_variable_2 = rnorm(4)
)

# Example solution
sample_df %>%
    mutate(date_time = floor_date(date_time, unit = "30 minutes")) %>%
    group_by(date_time) %>%
    summarise(across(.fns = last))
#> # A tibble: 2 × 3
#>   date_time           other_variable_1 other_variable_2
#>   <dttm>                         <dbl>            <dbl>
#> 1 2021-08-01 00:00:00           -0.768           -0.599
#> 2 2021-08-01 00:30:00            0.975            0.441
Created on 2021-08-01 by the reprex package (v2.0.0)
1 Like
Thanks so much! This worked perfectly.
This topic was automatically closed 7 days after the last reply. New replies are no longer allowed.
If you have a query related to it or one of the replies, start a new topic and refer back with a link.