Summarize function produce wrong mean

Hi All,

I am looking to create an interaction plot where I need to get the mean of linear growth. Using the summarize function, my mean is different from the mean i manually calcuated from excel.

Here is my a subset of my data.

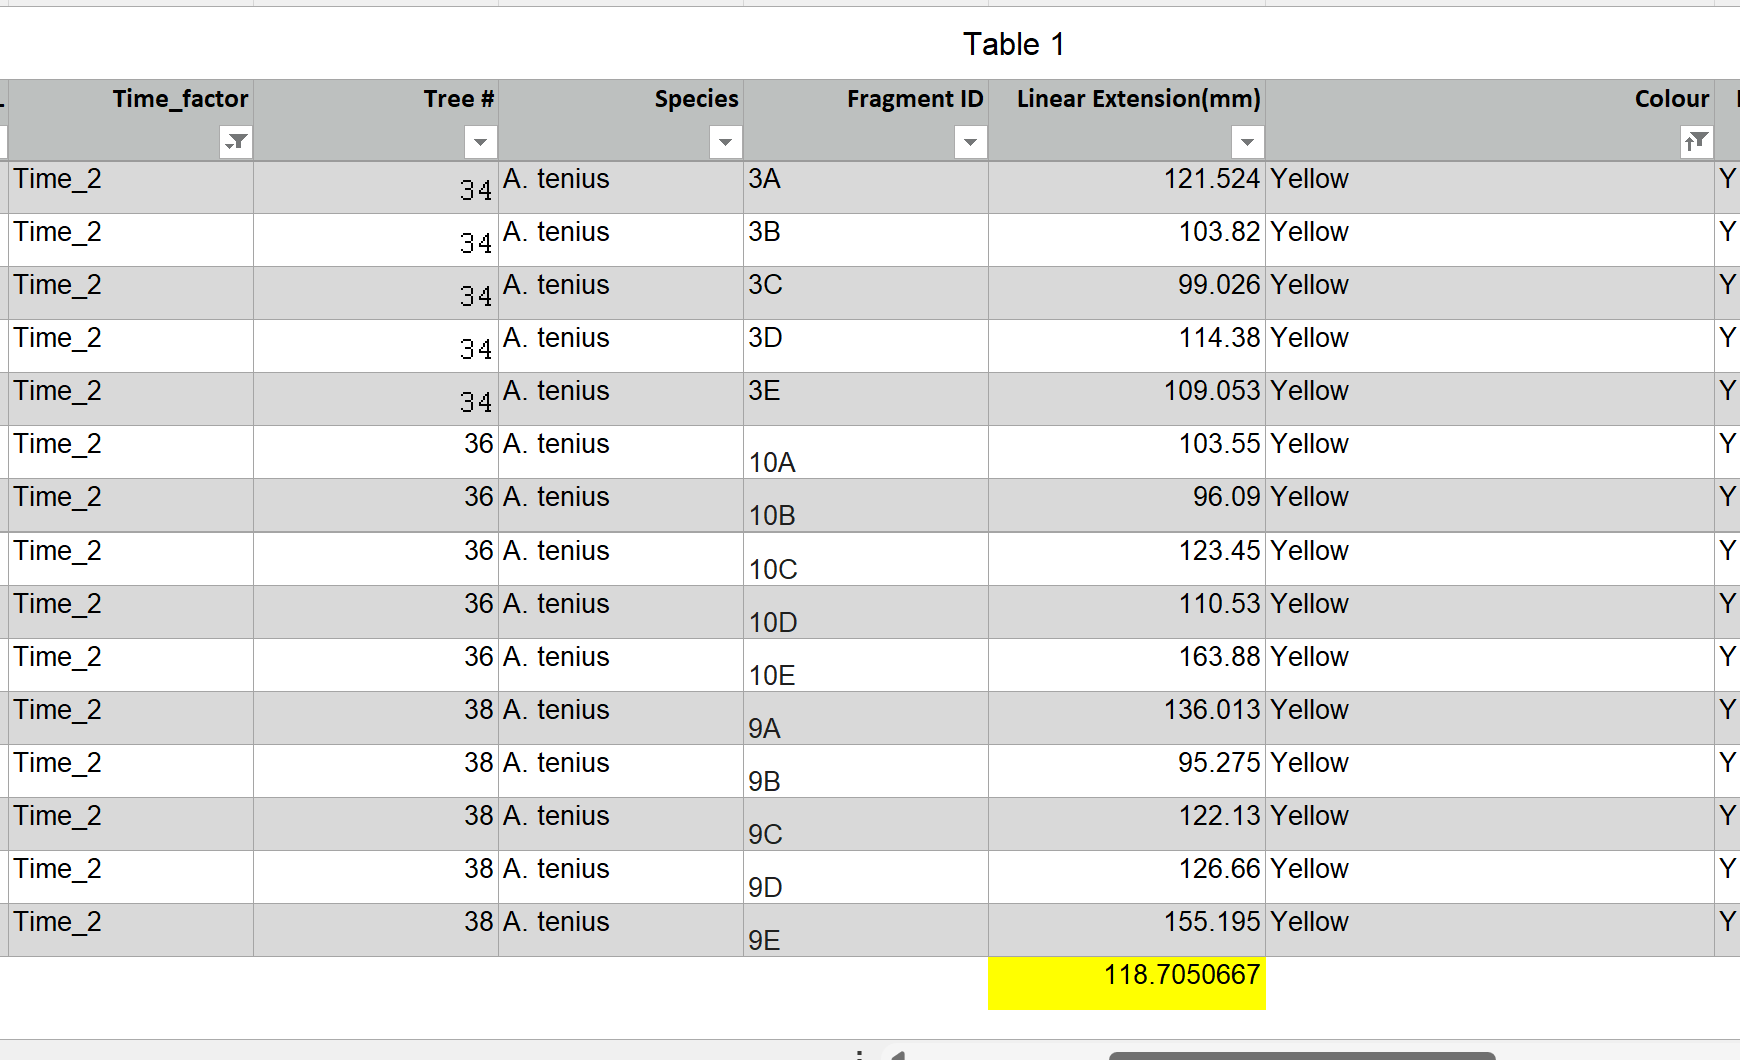
The mean for the linear growth for yellow at time 2 is 118.7050667.

Using the summarize function on R :
sum = Summarize(Linear.Extension.mm.~ Time_factor+ Colour)
sum$se= sum$sd / sqrt(sum$n)
sum

Time_factor Colour n mean sd min Q1 median Q3 max se
1 Time_0 Blue 15 78.60000 26.23193 22 65.50 83.0 91.00 123 6.773056
2 Time_1 Blue 15 84.53333 46.72697 13 48.00 94.0 118.00 147 12.064851
3 Time_2 Blue 15 45.26667 50.18461 2 11.50 31.0 40.50 148 12.957611
4 Time_0 Brown 20 76.95000 25.22629 46 55.00 74.5 102.00 120 5.640770
5 Time_1 Brown 20 86.40000 42.91411 3 65.25 99.5 117.50 138 9.595887
6 Time_2 Brown 20 83.70000 51.79524 10 34.50 88.0 131.75 150 11.581769
7 Time_0 Yellow 15 76.86667 24.27187 45 62.50 69.0 85.50 132 6.266971
8 Time_1 Yellow 15 93.73333 45.38324 1 66.00 110.0 126.50 142 11.717901
9 Time_2 Yellow 15 46.60000 49.46543 4 16.00 27.0 42.50 145 12.771919

this is what i got. all the mean from different colors at different time are different from those manually calculate from excel.

Does anyone know why this happened? or is there a better function?

UPDATE
All the codes type from the console.

library(ggplot2)
library(rlang)
attach(data1)
library(FSA)

sum = Summarize(lineargrown ~ color+Time,)
sum$se= sum$sd / sqrt(sum$n)
sum

pd = position_dodge(.2)

ggplot(sum,
aes(x = Time,
y = mean,
color = color)) +

geom_point(shape = 15,
size = 4,
position = pd) +
geom_errorbar(aes(ymin = mean - se,
ymax = mean + se),
width = 0.2,
size = 0.7,
position = pd) +
theme_bw() +
theme(axis.title = element_text(face = "bold")) +

ylab("Linear Growth")

Have you cross checked your manual calculations well?

Hello.
Thanks for providing code , but you could take further steps to make it more convenient for other forum users to help you.

Share some representative data that will enable your code to run and show the problematic behaviour.

You might use tools such as the library datapasta, or the base function dput() to share a portion of data in code form, i.e. that can be copied from forum and pasted to R session.

Reprex Guide

yes. did it with excel did it manually.

Will do.

Just update whatever I had in the console. to my original post

Please provide the relevant data to calculate your issue. If I run the FSA::Summarize() function on your data above, it works as expected:

data <- data.frame(
  time_factor = rep('Time2',15),
  colour = rep('Yellow',15),
  lin_ext_mm = c(121.524, 103.82, 99.026, 114.38, 109.053,
                 103.55, 96.09, 123.45, 110.53, 163.88,
                 136.013, 95.275, 122.13,126.66,155.195)
)
sum <- FSA::Summarize(object = data$lin_ext_mm ~ data$time_factor + data$colour)
sum$se <- sum$sd / sqrt(sum$n)

sum
#>   data$time_factor data$colour  n     mean       sd    min      Q1 median
#> 1            Time2      Yellow 15 118.7051 20.45019 95.275 103.685 114.38
#>        Q3    max       se
#> 1 125.055 163.88 5.280216

Created on 2022-08-30 by the reprex package (v2.0.1)

So please provide your data (at least everything you have in R which is associated with data$time_factor == "Time2" and data$color == "Yellow", just so we can check what is going on. However, with the given values from the screenshot, there seems to be no issues at all.

Kind regards

1 Like

Thanks for this.

I found out the issue. It happens when when im transform the variable of linear extenstion to be numeric. Redid that again and works fine!

Cheers!

This topic was automatically closed 7 days after the last reply. New replies are no longer allowed.

If you have a query related to it or one of the replies, start a new topic and refer back with a link.