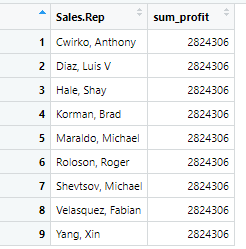
I am trying to group a data set by Sales rep and summing profit column but for some reason im getting the same number for each salesrep. That number makes sense, its the sum of the entire profit colum, but why is it the same for each rep? It shouldnt be.
Looks like the mistake is in how you structured the elements within the summarize() function.
It should be summarise(sum_profit = sum(profit))
See my example:
library(tidyverse)

sample_data <- txhousing # sample data set included in ggplot2

sample_data %>%
  # in this case, total number sales for each city each year
  group_by(city, year) %>%
  # note the syntax for summarise using pipes %>%
  summarise(sales_sum = sum(sales)) %>%
  ungroup()
#> `summarise()` has grouped output by 'city'. You can override using the
#> `.groups` argument.
#> # A tibble: 736 × 3
#>    city     year sales_sum
#>    <chr>   <int>     <dbl>
#>  1 Abilene  2000      1375
#>  2 Abilene  2001      1431
#>  3 Abilene  2002      1516
#>  4 Abilene  2003      1632
#>  5 Abilene  2004      1830
#>  6 Abilene  2005      1977
#>  7 Abilene  2006      1997
#>  8 Abilene  2007      2003
#>  9 Abilene  2008      1651
#> 10 Abilene  2009      1634
#> # ℹ 726 more rows