Hello!! I am trying to get the sum values at the top of each bar and I am having some trouble. My code is as follows:
load("H:\\Personal\\provider1.csv")
d=read.csv("provider1.csv", header=T)
library(ggplot2)
library(dplyr)

totals<- d %>%
	group_by(Date) %>%
	summarise(total=sum(Appointments))

ggplot(d, aes(fill=Provider, y=Appointments, x=Date)) +
	geom_bar(position="stack", stat="identity") +
	geom_text(aes(label=Appointments, totals))
I get an error with this code:rlang::last_error() to see where the error occurred.
Here is a sample of my data:
'data.frame':   32 obs. of  3 variables:
 $ Provider    : chr  "MW, MD" "MW, MD" "MW, MD" "MW, MD" ...
 $ Date        : chr  "Jan-20" "Feb-20" "Jun-20" "Jul-20" ...
 $ Appointments: int  81 69 80 93 80 66 81 63 64 54 ...
There are 4 different dates and 8 different providers.
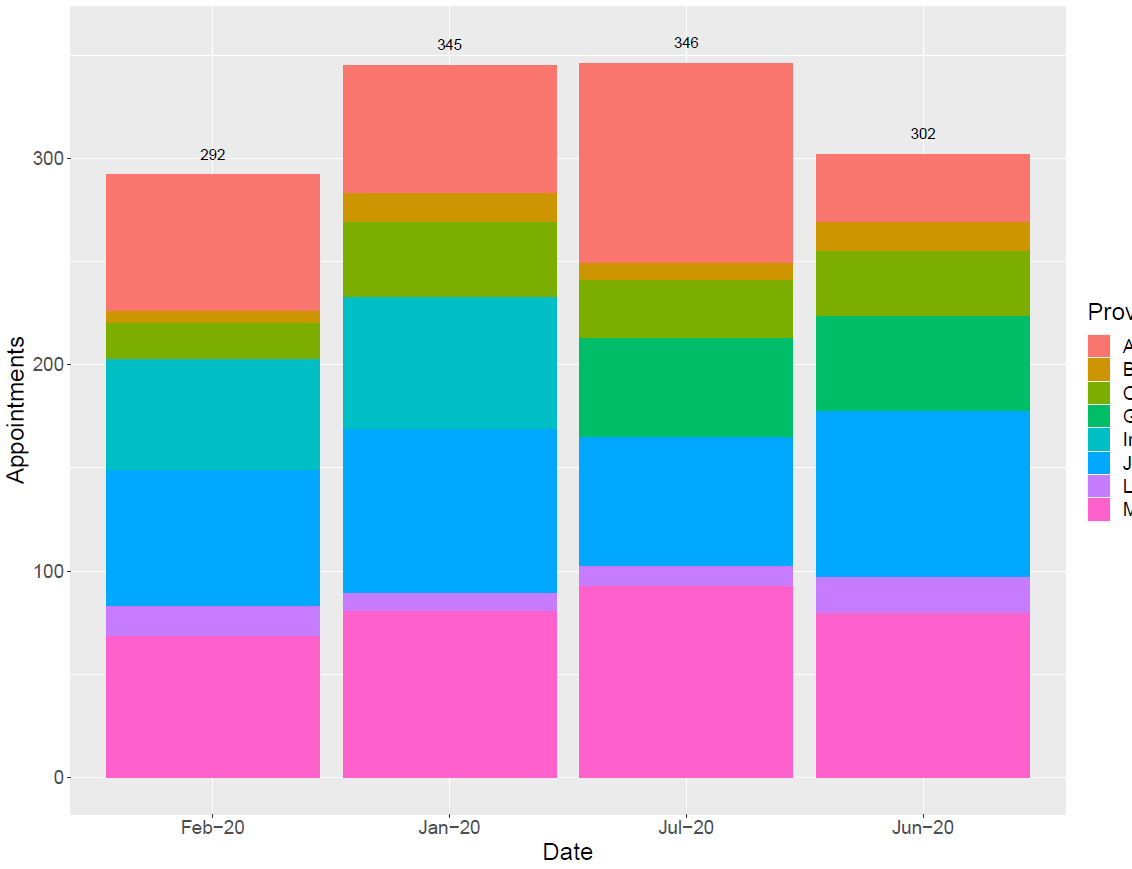
When I don't add the last word of my code, "totals," I can see the bar chart, but the labels are for each different provider and they are all muddled on each bar. I only want the totals at the top.
Thanks for your help!!
1 Like
library(ggplot2)
library(dplyr)

(d <- data.frame(Date=
                  rep(seq.Date(from=Sys.Date(),
                           by = 1,
                           length.out = 3),3)
                ,
                Appointments = sample.int(100,9,replace = TRUE),
                Provider = sample.int(2,9,replace=TRUE)))

totals<- d %>%
  group_by(Date) %>%
  summarise(total=sum(Appointments))

ggplot(d, aes( fill=Provider,y=Appointments, x=Date)) +
  geom_bar(position="stack", stat="identity") +
  geom_text(data=totals ,aes(x=Date,y=total,label=total,fill=NULL),
            nudge_y = 10)
1 Like
Thanks so much for your help!!
One more question if anyone may know how to help, that would be greatly appreciated!
Now I am trying to get the dates on the X axis to no longer be in alphabetical order, but be in order of the dates (ex. jan20, feb20, june20, july20).
My code is now:
load("H:\\Personal\\provider1.csv")
d=read.csv("provider1.csv", header=T)
library(ggplot2)
library(dplyr)

totals<- d %>%
	group_by(Date) %>%
	summarise(total=sum(Appointments))
ggplot(d, aes(fill=Provider, y=Appointments, x=Date)) +
	geom_bar(position="stack", stat="identity") +
	geom_text(data=totals, aes(x=Date, label=total, y=total, fill=NULL), nudge_y=10) +
	theme(text=element_text(size=18))
Dataset is same as above.
Thank you!
1 Like
One more question if anyone may know how to help, that would be greatly appreciated!
Now I am trying to get the dates on the X axis to no longer be in alphabetical order, but be in order of the dates (ex. jan20, feb20, june20, july20).
My code is now:
load("H:\\Personal\\provider1.csv")
d=read.csv("provider1.csv", header=T)
library(ggplot2)
library(dplyr)

totals<- d %>%
	group_by(Date) %>%
	summarise(total=sum(Appointments))
ggplot(d, aes(fill=Provider, y=Appointments, x=Date)) +
	geom_bar(position="stack", stat="identity") +
	geom_text(data=totals, aes(x=Date, label=total, y=total, fill=NULL), nudge_y=10) +
	theme(text=element_text(size=18))
its useful to convert date to a factor, forcats package in tidyverse makes it convenient, as you can rely on it to order the factor levels by the order in which they are encountered, so you can sort your dataset by date before the conversion
library(ggplot2)
library(dplyr)
library(forcats)

(d <- data.frame(Date=
                  rep(seq.Date(from=Sys.Date(),
                           by = 45,
                           length.out = 3),3)
                ,
                Appointments = sample.int(100,9,replace = TRUE),
                Provider = sample.int(2,9,replace=TRUE)))

d <- arrange(d,
             Date)
d$Date <- forcats::as_factor(as.character(d$Date,format="%b-%Y"))


totals<- d %>%
  group_by(Date) %>%
  summarise(total=sum(Appointments))

ggplot(d, aes( fill=Provider,y=Appointments, x=Date)) +
  geom_bar(position="stack", stat="identity") +
  geom_text(data=totals ,aes(x=Date,y=total,label=total,fill=NULL),
            nudge_y = 10)
Thank you for your response! I am still having a little bit of trouble however. The order of the dates did not change at the bottom.. My code now looks like this (below). Am I missing something?
load("H:\\Personal\\provider1.csv")
d=read.csv("provider1.csv", header=T)
library(ggplot2)
library(dplyr)
library(forcats)

d <- arrange(d,
             Date)
d$Date <- forcats::as_factor(as.character(d$Date,format="%b-%Y"))


totals<- d %>%
	group_by(Date) %>%
	summarise(total=sum(Appointments))

ggplot(d, aes(fill=Provider, y=Appointments, x=Date)) +
	geom_bar(position="stack", stat="identity") +
	geom_text(data=totals, aes(x=Date, label=total, y=total, fill=NULL), nudge_y=10) +
	theme(text=element_text(size=18))
what happens when you write into the console:
levels(d$Date)
 levels(d$Date)
[1] "Feb-20" "Jan-20" "Jul-20" "Jun-20"
im guessing that at this point
d=read.csv("provider1.csv", header=T)
the Date are not in Date type form, so there is no basis to order them as dates would be ordered.
d <- mutate( d, Date= readr::parse_date(Date,format = "%b-%y"))
Ah! Thank you, this worked when I took the dates out of word form and changed it to only numbers. Thank you so much for your help!
system
July 27, 2020, 6:12pm
13
This topic was automatically closed 7 days after the last reply. New replies are no longer allowed.