Please suggest me the best possible graph to be created for this data on world heritage sites using Rstudio and ggplot2.
This depends on the question you are trying to answer.
What are you trying to do?
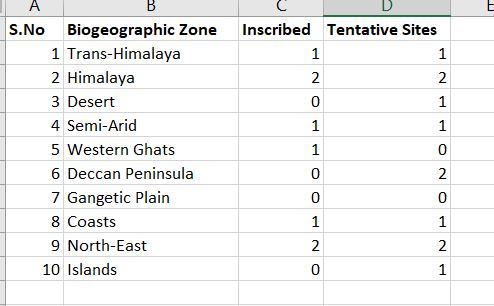
I am trying to represent the share of inscribed world heritage sites and tentative sites in each biogeographic zone of India.
How about a choropleth map then? You can create one in ggplot2.
A graph could still be better though.
'Best' is subjective here.
What will be the code?
Here is an example. You would have to get the right spatial data for India, but it should freely available if you know where to look.
1 Like
You should be aware you can only encode 1 value with a Choropleth map, you have 2 and also your resolution isn't very fine-grained.
If you want to go on with showing your data in a geospatial context I would suggest using the geofacet package.
https://cran.r-project.org/web/packages/geofacet/vignettes/geofacet.html
See the examples down there in the vignette, there is even an indian population breakdown, with 2 bars. This could be similar to your outcome, however you may need to define your own map for this.
PS: I have doubts your numbers are very useful. From 1 to 2 it's twice the amount but in thew end it's just one more.
1 Like
No I dont want my dat in geospatial context. It is a basic data to further go into the research so a basic decent graph would be helpful if you can guide me through it
Maybe this helps a bit?
1 Like
A simple dot chart might do it. There really is not a lot one can do with that amount of data.
suppressMessages(library(data.table))
suppressMessages(library(tidyverse))
DT  <- data.table(
         sno = c(1L, 2L, 3L, 4L, 5L, 6L, 7L, 8L, 9L, 10L),
         bio = c("Trans–Himalaya","Himalaya","Desert",
                 "Semi–Arid","Western Ghats","Deccan Peninsula","Gangetic Plain",
                 "Coasts","North East","Islands"),
   Inscribed = c(1L, 2L, 0L, 1L, 2L, 0L, 0L, 1L, 2L, 0L),
   Tentative = c(1L, 2L, 1L, 1L, 0L, 2L, 0L, 1L, 2L, 1L)
)
DT1 <- melt(DT, id.vars       = "bio" , "sno",
            measure.vars  = c("Inscribed", "Tentative"),
            variable.name = "Status",
            value.name    = "Sites")[, Sites := as.factor(Sites)]

ggplot(DT1, aes(bio, Sites, colour = as.factor(Status))) + geom_point() +
    coord_flip()  + labs(colour = "Status") + xlab("Biogeograhic Zone")
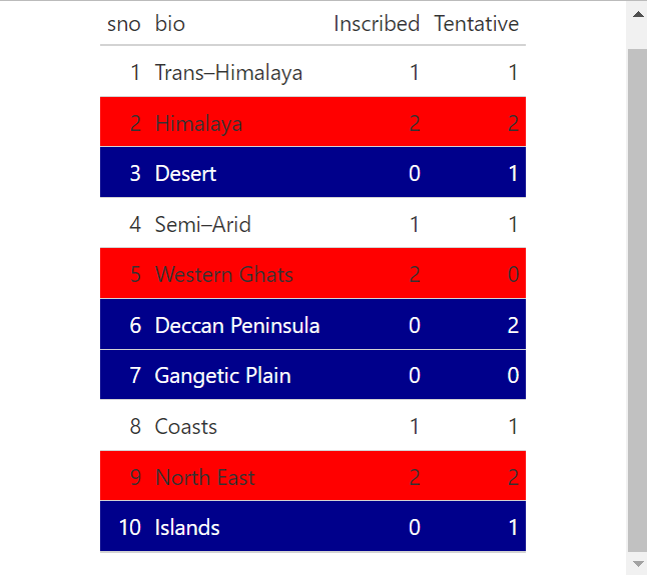
I appreciate this may be some purely academic exercise in 2 dimensional graphical chart construction...
but in a more general context, it can sometimes be worth considering, keeping the information in a tabular form, and if we need to draw the eye to certain info, we can use colourful styling to achieve that sort of effect.
example:
library(gt)
DT  <- structure(list(sno = 1:10, bio = c("Trans–Himalaya", "Himalaya",
                                          "Desert", "Semi–Arid", "Western Ghats", "Deccan Peninsula",
                                          "Gangetic Plain", "Coasts", "North East", "Islands"), Inscribed = c(1L,
                                                                                                              2L, 0L, 1L, 2L, 0L, 0L, 1L, 2L, 0L), Tentative = c(1L, 2L, 1L,
                                                                                                                                                                 1L, 0L, 2L, 0L, 1L, 2L, 1L)), class = "data.frame", row.names = c(NA,
                                                                                                                                                                                                                                   -10L))
gt(DT) |> tab_style(
  style = list(cell_fill(color = "darkblue"),
               cell_text(color = "white")),
  locations = cells_body(
    rows = Inscribed ==0
  ))|> tab_style(
    style = cell_fill(color = "red"),
    locations = cells_body(
      rows = Inscribed ==2
    ))
2 Likes
This topic was automatically closed 7 days after the last reply. New replies are no longer allowed.
If you have a query related to it or one of the replies, start a new topic and refer back with a link.