Could you teach me what is the cause for this code?
Previously, I could execute the same code which csv was a few more rows...
Is it due to the small number of csv rows?
Although the likelihood of this is quite low...
x = read.csv("mydata.csv", header = TRUE, row.names = 1)
y = as.matrix(x)
for(i in 2:(nrow(y)-1)){
pam(y, k = i, metric = "euclidean")
}
#metric="euclidean" may not need
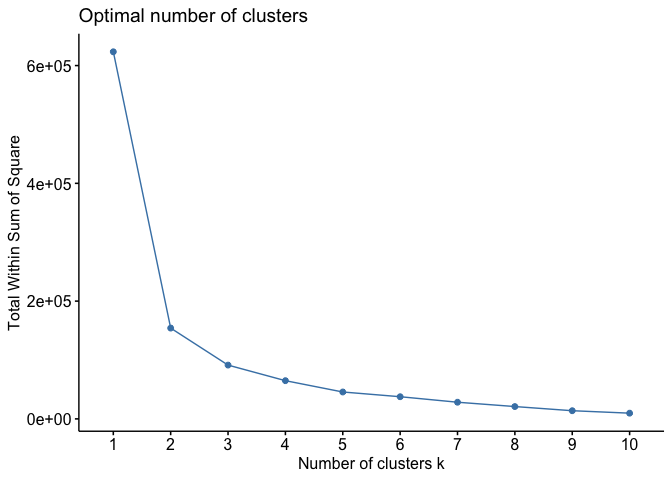
fviz_nbclust(y, pam, method = "wss")
Error in FUNcluster(x, i, ...) :
Number of clusters 'k' must be in {1,2, .., n-1}; hence n >= 2
library(cluster)
library(factoextra)
#> Loading required package: ggplot2
#> Welcome! Want to learn more? See two factoextra-related books at https://goo.gl/ve3WBa
# the next statement does not return anything
for(i in 2:(nrow(mtcars)-1)) pam(mtcars,i)
# mtcars has dim 32 11
fviz_nbclust(mtcars, pam, method = "wss")
# try with dim 16 11
fviz_nbclust(mtcars[1:16,], pam, method = "wss")
# # try with dim 8 11
fviz_nbclust(mtcars[1:8,], pam, method = "wss")
#> Error in FUNcluster(x, i, ...): Number of clusters 'k' must be in {1,2, .., n-1}; hence n >= 2
yes; we don't have your data; mtcars is an example ...
you have some code that before fviz_nblust, manually runs pam through possibilities; but you dont capture that; or look at it for anything....
You might consider changing it so that it shows you that highest possible k; you could then use that in fviz_nbclust
library(cluster)
y <- mtcars[1:8,]
for(i in 2:(nrow(y)-1)){
  pamx <- pam(y, k = i, metric = "euclidean")
  cat("k = ", i,"\n")
  print(unique(pamx$clustering))
}
note here mtcars is an example; that all forum users can use.
you could have provided your own example; but you didnt...
If you want to read advice on providing custom examples; I would encourage you to look here :