Hi,
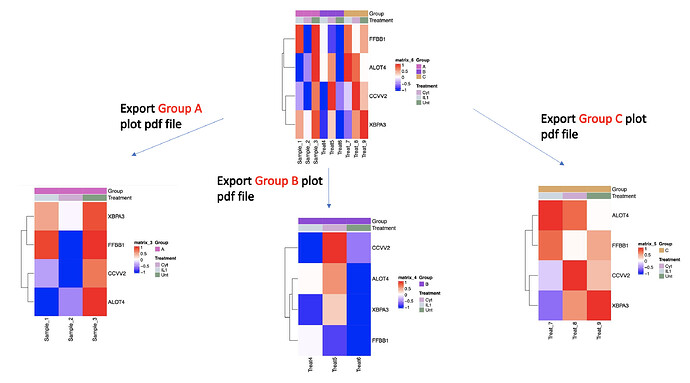
I am working with dataframes in R one containing the quantitative data and other one with sample metadata and trying to plot a heatmap using library(ComplexHeatmap) package. I am currently analyzing by subsetting based on each "Group" individually and exporting the pdf plot. On my large datasets, this process becomes very tedious and cumbersome. I am exploring a way to loop to subset the data based on the "Group A, B, and C" from the sample metadata and generate separate plots in the form of the pdf file. I have provided the input data and expected results below. Please advise on how to solve this.
Thank you,
Toufiq
## Quantitative input data
dput(my_matrix_Z)
structure(c(0.932604654502187, -0.435436614072738, 0.477426784581654,
            -1.46076832746542, -1.31037812634022, -1.01424032341432, -0.0404822682927365,
            -0.539937618199118, 1.38721958124815, 0.707658540034404, 0.892420147849494,
            1.03812906674728, -0.0358377647341346, -1.43311295375476, -0.940550471704507,
            0.0203370331247248, -0.871773522040406, 1.04199433191731, 0.270457448714327,
            0.581830150089182, -1.38089368299436, -0.60547605837307, -1.88380551789616,
            -1.53172474098731, 0.772474453928738, -0.227861010731477, -0.656505388793654,
            1.09553965503928, 0.0346508158080517, 1.61146228986793, 0.5749024862802,
            0.78190001284444, 0.471933590622001, 0.355011798526725, 1.30613677926137,
            0.014694768806926), .Dim = c(4L, 9L), .Dimnames = list(c("FFBB1",
                                                                     "CCVV2", "XBPA3", "ALOT4"), c("Sample_1", "Sample_2", "Sample_3",
                                                                                                   "Treat4", "Treat5", "Treat6", "Treat_7", "Treat_8", "Treat_9"
                                                                     )))
#>         Sample_1    Sample_2  Sample_3      Treat4     Treat5     Treat6
#> FFBB1  0.9326047 -1.31037813 1.3872196 -0.03583776 -0.8717735 -1.3808937
#> CCVV2 -0.4354366 -1.01424032 0.7076585 -1.43311295  1.0419943 -0.6054761
#> XBPA3  0.4774268 -0.04048227 0.8924201 -0.94055047  0.2704574 -1.8838055
#> ALOT4 -1.4607683 -0.53993762 1.0381291  0.02033703  0.5818302 -1.5317247
#>          Treat_7    Treat_8    Treat_9
#> FFBB1  0.7724745 0.03465082 0.47193359
#> CCVV2 -0.2278610 1.61146229 0.35501180
#> XBPA3 -0.6565054 0.57490249 1.30613678
#> ALOT4  1.0955397 0.78190001 0.01469477

## Sample metadata
dput(Sample_Info)
structure(list(Group = c("A", "A", "A", "B", "B", "B", "C", "C",
                         "C"), Treatment = c("IL1", "Cyt", "Unt", "IL1", "Cyt", "Unt",
                                             "IL1", "Cyt", "Unt")), class = "data.frame", row.names = c("Sample_1",
                                                                                                        "Sample_2", "Sample_3", "Treat4", "Treat5", "Treat6", "Treat_7",
                                                                                                        "Treat_8", "Treat_9"))
#>          Group Treatment
#> Sample_1     A       IL1
#> Sample_2     A       Cyt
#> Sample_3     A       Unt
#> Treat4       B       IL1
#> Treat5       B       Cyt
#> Treat6       B       Unt
#> Treat_7      C       IL1
#> Treat_8      C       Cyt
#> Treat_9      C       Unt

## Subset the data;
my_matrix_Z_A <- my_matrix_Z[, c(1:3)]
Sample_Info_A <- Sample_Info[c(1:3), ]
my_matrix_Z_B <- my_matrix_Z[, c(4:6)]
Sample_Info_B <- Sample_Info[c(4:6), ]
my_matrix_Z_C <- my_matrix_Z[, c(7:9)]
Sample_Info_C <- Sample_Info[c(7:9), ]

## Column annotations for all "Groups"
library(ComplexHeatmap)

column_ha = HeatmapAnnotation(df = data.frame(Group = Sample_Info$Group,
                                              Treatment = Sample_Info$Treatment),
                              col = list(Group = c("A" = "#DC61C5", "B" = "#9843DA", "C" = "#DDA862"),
                                         Treatment =c("IL1" = "#CBD7E1", "Cyt" = "#D3A9D4",  "Unt" = "#7B9F7F")))

## Column annotations for all Groups A
column_ha_A = HeatmapAnnotation(df = data.frame(Group = Sample_Info_A$Group,
                                              Treatment = Sample_Info_A$Treatment),
                              col = list(Group = c("A" = "#DC61C5"),
                                         Treatment =c("IL1" = "#CBD7E1", "Cyt" = "#D3A9D4",  "Unt" = "#7B9F7F")))

## Export the plot for all Groups
pdf("Plot_for_Group_All.pdf",height = 5, width = 5)
Heatmap(my_matrix_Z,
        col = circlize::colorRamp2(c(-1, 0, 1), c("blue", "white", "red")),
        cluster_columns = F,
        top_annotation = column_ha)
dev.off()

## Export the plot for "Group A"
pdf("Plot_for_Group_All.pdf",height = 5, width = 5)
Heatmap(my_matrix_Z_A,
        col = circlize::colorRamp2(c(-1, 0, 1), c("blue", "white", "red")),
        cluster_columns = F,
        top_annotation = column_ha_A)
dev.off()

Likewise,
## Export the plot for "Group B"
## Export the plot for "Group C"
Expected results:
Export plots as individual files
Created on 2022-02-26 by the reprex package (v2.0.1)
