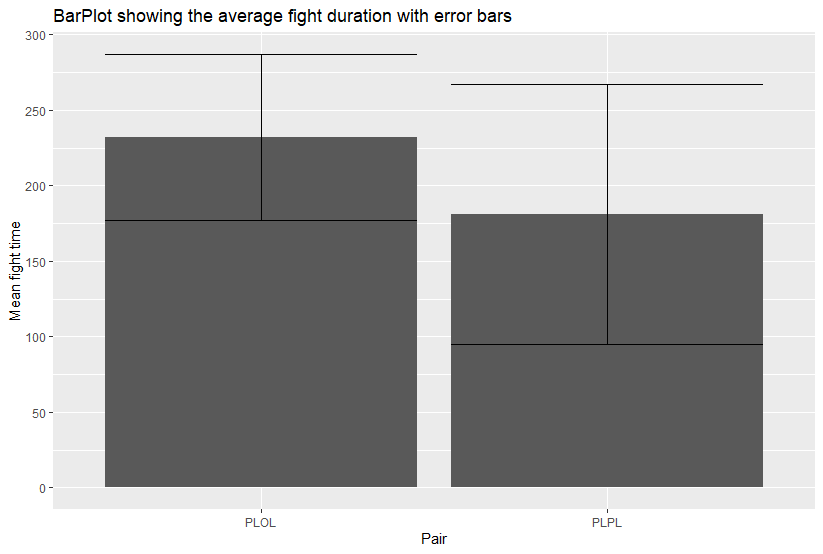
Trying to change the colour of the bar plot on ggplot2
code:
BarPlot2<- ggplot(Experiment1, aes(Experiment1$Pair, Experiment1$Fight.Duration..s., fill = Experiment1$Fight.Duration..s.)) +
stat_summary(geom = "bar", fun = mean, position = "dodge") +
stat_summary(geom = "errorbar", fun.data = mean_se, position = "dodge")
BarPlot2 + ggtitle("BarPlot showing the average fight duration with error bars") +
xlab("Pair") +
ylab("Mean fight time") +
labs(fill = "Pair") +
scale_fill_manual(values=c("blue", "red")) +
scale_y_continuous(breaks=seq(0, 350, 50))
And This is what comes out
Can you please turn this into a proper REPRoducible EXample (reprex) that includes sample data on a copy/paste friendly format?
data<- tibble::tribble(
         ~Fight.Number,  ~Pair, ~`Fight.Duration.(s)`,
                    1L, "PLOL",                  316L,
                    1L, "PLPL",                  339L,
                    2L, "PLOL",                  252L,
                    2L, "PLPL",                  161L,
                    3L, "PLOL",                  128L,
                    3L, "PLPL",                   43L
         )
head(data)
#> # A tibble: 6 x 3
#>   Fight.Number Pair  `Fight.Duration.(s)`
#>          <int> <chr>                <int>
#> 1            1 PLOL                   316
#> 2            1 PLPL                   339
#> 3            2 PLOL                   252
#> 4            2 PLPL                   161
#> 5            3 PLOL                   128
#> 6            3 PLPL                    43
Created on 2020-05-03 by the reprex package (v0.3.0)
library(ggplot2)
data<- tibble::tribble(
~Fight.Number, ~Pair, ~`Fight.Duration.(s)`,
1L, "PLOL", 316L,
1L, "PLPL", 339L,
2L, "PLOL", 252L,
2L, "PLPL", 161L,
3L, "PLOL", 128L,
3L, "PLPL", 43L
)
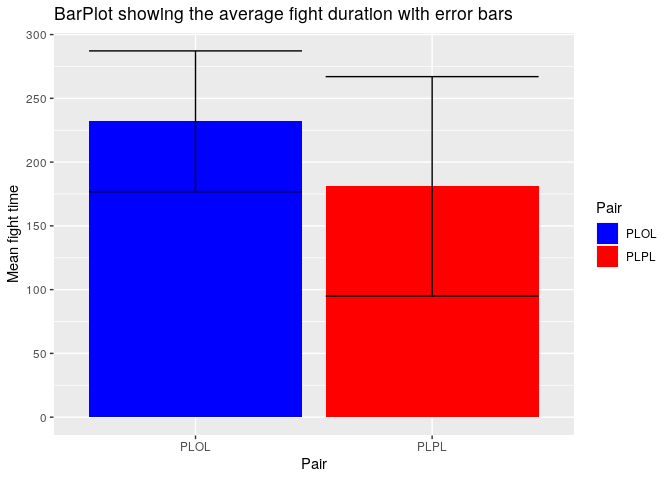
ggplot(data, aes(Pair, `Fight.Duration.(s)`, fill = Pair)) +
stat_summary(geom = "bar", fun = mean, position = "dodge") +
stat_summary(geom = "errorbar", fun.data = mean_se, position = "dodge") +
labs(title = "BarPlot showing the average fight duration with error bars",
x = "Pair",
y = "Mean fight time",
fill = "Pair") +
scale_fill_manual(values=c("blue", "red")) +
scale_y_continuous(breaks=seq(0, 350, 50))
Created on 2020-05-03 by the reprex package (v0.3.0)
system
Closed
6
This topic was automatically closed 7 days after the last reply. New replies are no longer allowed.