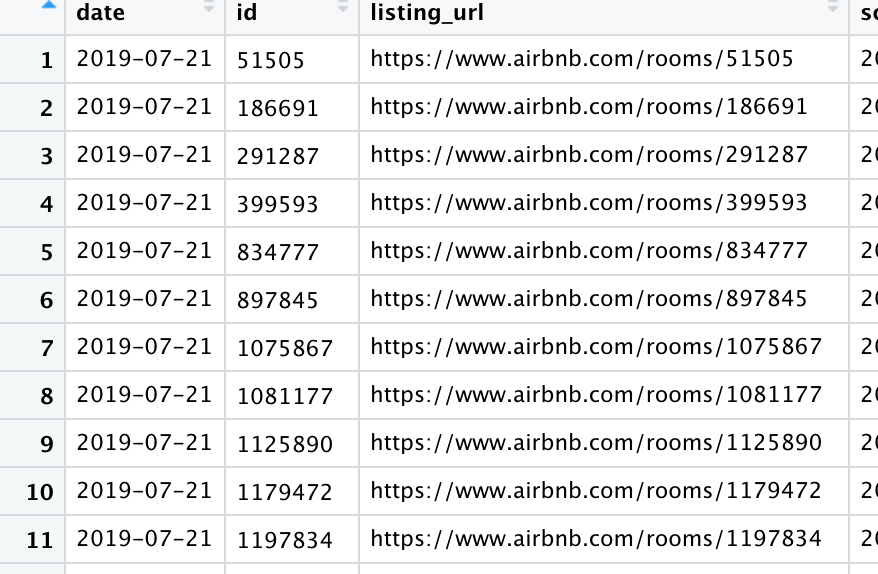
Hi there, I am struggling to create a bar graph with my date variable which doesn't appear under variables when I click on bar chart. It is written as 2019-09-07 (for example). Do the dashes need to go?
Thanks!
Hi there, I am struggling to create a bar graph with my date variable which doesn't appear under variables when I click on bar chart. It is written as 2019-09-07 (for example). Do the dashes need to go?
Thanks!
Hi!
To help us help you, could you please prepare a reproducible example (reprex) illustrating your issue? Please have a look at this guide, to see how to create one:
Hi s1518672!
Does this code block give you a starting place?
This is a reprex.
If you can produce one with your own data, other users will be able to help you with your specific problem.
library(tidyverse)
# toy data
df <- data.frame(
date = as.Date(c('2017-09-17', '2017-09-21','2017-09-17', '2017-09-21', '2017-09-17', '2017-09-21')),
rooms = c(3, 7, 4, 17, 5, 21)
)
head(df)
#> date rooms
#> 1 2017-09-17 3
#> 2 2017-09-21 7
#> 3 2017-09-17 4
#> 4 2017-09-21 17
#> 5 2017-09-17 5
#> 6 2017-09-21 21
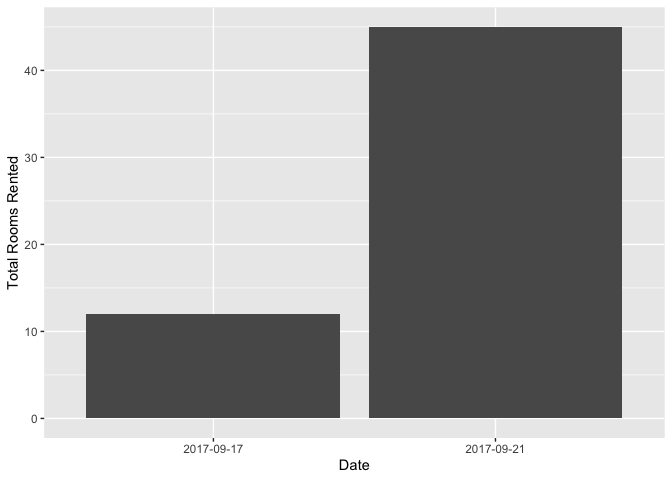
df %>%
group_by(date) %>%
summarize(rooms_total = sum(rooms)) %>%
ggplot(aes(x = as.factor(date),
y = rooms_total)) +
geom_bar(stat = 'identity') +
labs(x = "Date", y = "Total Rooms Rented")
Created on 2019-10-17 by the reprex package (v0.3.0)
This topic was automatically closed 21 days after the last reply. New replies are no longer allowed.