I tired with your example data.
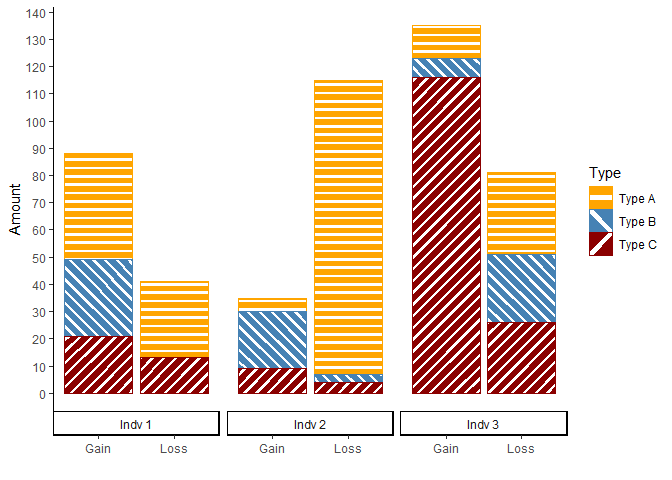
Use scale_pattern_angle_manual() to assign different angles for the patterns.
cData <- structure(list(Individual = c("Indv 1", "Indv 2", "Indv 3", "Indv 1", "Indv 2", "Indv 3", "Indv 1", "Indv 2", "Indv 3",
                                       "Indv 1", "Indv 2", "Indv 3", "Indv 1", "Indv 2", "Indv 3", "Indv 1", "Indv 2", "Indv 3"),
                        Change = c("Gain", "Gain", "Gain", "Gain", "Gain", "Gain", "Gain", "Gain", "Gain",
                                   "Loss", "Loss", "Loss", "Loss", "Loss", "Loss", "Loss", "Loss", "Loss"),
                        Type = c("Type A", "Type A", "Type A", "Type B", "Type B", "Type B", "Type C", "Type C", "Type C",
                                 "Type A", "Type A", "Type A", "Type B", "Type B", "Type B", "Type C", "Type C", "Type C"),
                        Value = c(39L, 5L, 12L, 28L, 21L, 7L, 21L, 9L, 116L, 28L, 108L, 30L, 0L, 3L, 25L, 13L, 4L, 26L),
                        Stripe_Angle = c(25L, 25L, 25L, 135L, 135L, 135L, 90L, 90L, 90L, 25L, 25L, 25L, 135L, 135L,
                                         135L, 90L, 90L, 90L)), row.names = c(NA, -18L), class = "data.frame")

library(ggplot2)
library(dplyr)
library(ggpattern)

colr <- c("orange", "steelblue", "darkred")

cData %>%
  ggplot(aes(x=Change, y=Value), pattern="stripe") +
  geom_col_pattern(aes(pattern_angle=Type, color=Type, fill=Type),
                   pattern_fill="white", pattern_color="white", pattern_spacing=.05) +
  scale_color_manual(values = colr) +
  scale_fill_manual(values = colr) +
  scale_pattern_angle_manual(values = c(0, -45, 45)) +
  scale_y_continuous(breaks = seq(0, 140, 10)) +
  labs(x="", y="Amount") +
  facet_grid(~Individual, switch = "x") +
  theme_classic()
Created on 2022-03-02 by the reprex package (v2.0.1)