We've started using plumber in our production environments. I finally got around to stress testing a smaller vm to see the results:
Box Specs:
Ubuntu 16.04 (On Azure)
4 vCPU's
64G ram
API Setup:
8 docker containers behind nginx as the load balancer (can include the settings for anyone interested but I'll need to clean them a bit, I did not enable caching)
This API usually responds in 0.2s under normal load.
Siege Results:
 siege -c100 -b -i -f url.txt -lsiegee.log
** SIEGE 3.0.8
** Preparing 100 concurrent users for battle.
The server is now under siege...
^C
Lifting the server siege...      done.

Transactions:                    723 hits
Availability:                  98.23 %
Elapsed time:                  32.95 secs
Data transferred:               3.53 MB
Response time:                  3.40 secs
Transaction rate:              21.94 trans/sec
Throughput:                     0.11 MB/sec
Concurrency:                   74.60
Successful transactions:         723
Failed transactions:              13
Longest transaction:            4.57
Shortest transaction:           0.27
During the siege I get these errors:
[alert] socket: 1987888896 select timed out: Connection timed out
[alert] socket: -1895835904 select timed out: Connection timed out
[alert] socket: -1929406720 select timed out: Connection timed out
[alert] socket: 1786464000 select timed out: Connection timed out
[alert] socket: 2055030528 select timed out: Connection timed out
[alert] socket: -2105653504 select timed out: Connection timed out
[alert] socket: 2080208640 select timed out: Connection timed out
[alert] socket: 1761285888 select timed out: Connection timed out
[alert] socket: -1879050496 select timed out: Connection timed out
[alert] socket: -1753159936 select timed out: Connection timed out
[alert] socket: 1870391040 select timed out: Connection timed out
[alert] socket: 2105386752 select timed out: Connection timed out
[alert] socket: -1962977536 select timed out: Connection timed out
(I cannot reproduce these errors under normal load)
Any guesses what those socket errors might be?
Example of a log during that error:
App=nginx,localtime=[08/Aug/2018:17:02:31 +0000],remoteaddr="XXXXXX",request="GET XXXX│·························
8 HTTP/1.1",worker_status=-,worker_addr="127.0.0.1:9301",upstream_response_time=-,request_time=3.550;round_trip_time=885
The hyphen stands out in the upstream response time.
According to Configuring Logging | NGINX Documentation
In case of internal error while connecting to an upstream or when a reply is taken from the cache, the variable contains “-” (hyphen)
I don't have any caching configured, so it looks like an error connecting to the upstream box.
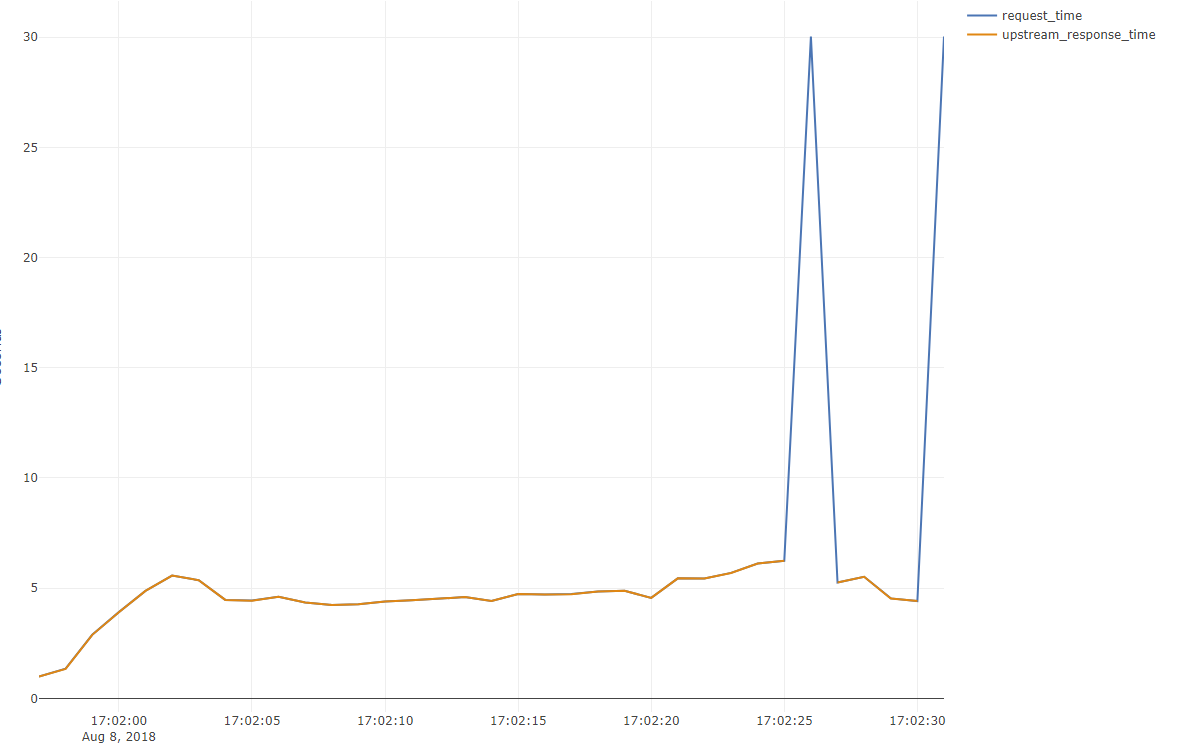
Upstream Response Time, Request Time, during siege
Additional Notes
When I check my container logs I see this: <simpleError in Ops.data.frame(REDACTED): ‘+’ only defined for equally-sized data frames>
Any guesses what limit I'm running into here or where I could look for more informative logs? Is this plumber? or maybe the docker socket?
EDIT:
I know there's a stackexchange answer that suggests this could be an issue with a version of siege, I will build their dev version and check. But I doubt it, for one, I've seen this behavior in our production application before as well, under heavy load, and for two it's an update from 6 months ago.