stat_bin() can only have an x or y aesthetic

Hi, I am very very new to rstudio and struggle with it/the terminology of R immensely so please bare with me when I try to explain what I’m doing and why!

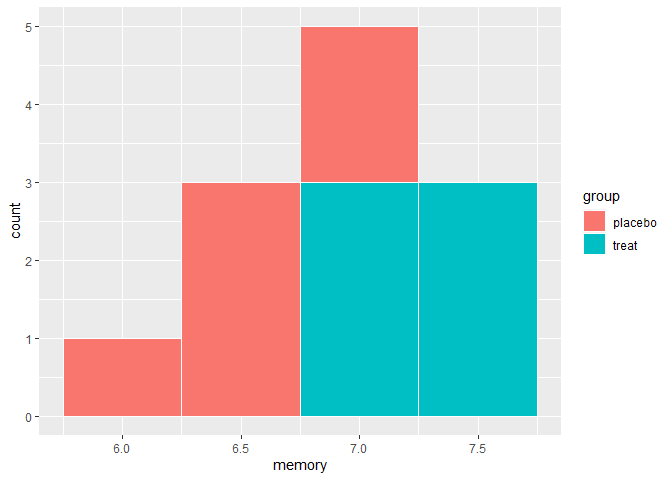
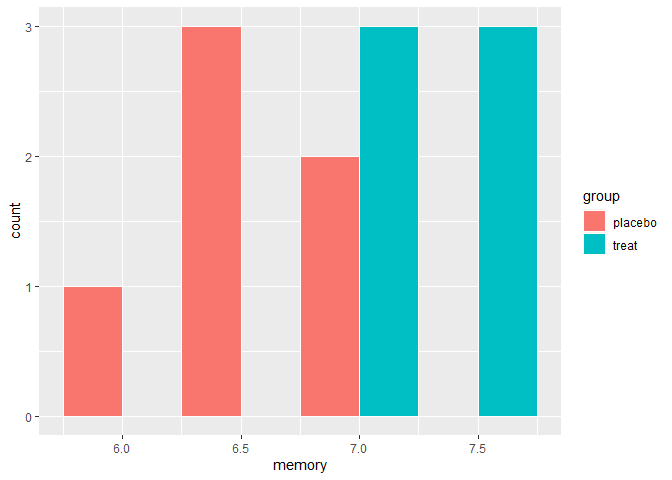
I’m trying to plot a histogram of data representing values for "memory" against values for "time" in a particular group of participants that I have created a subset for. I have been using the below code:

hist <- ggplot(data = dataSubset, aes(x = memory, y = time)) +
    geom_histogram(bins = 0.2, fill = 'midnightpurple') +
    xlim(5, 9) 
    theme_classic()
hist

but I am met with "stat_bin() can only have an x or a y aesthetic " every time. I've looked in my books and also on the internet but cant fathom out where I am going wrong. As I said already I am very new to rstudio and very unfamiliar with the package as a whole so I really would appreciate any help I can get.

Thank you

A typical histogram has a continuous variable on the x axis that has been divided into bins and on the y axis it has a count of the number of samples within each bin. Because of that, you should not need to supply data to the y axis and that is what ggplot is complaining about.

Do you want to draw separate histograms for different values of time?

Can you post a little of your data and explain more about what you want to plot? To show the data, you can post the output of

dput(head(dataSubset))

Please put a line containing only three back ticks, ```, just before and just after the function output.
```
Your copied output here.
```

Hi there, thank you for your reply. I think I got the information I needed for the graph mixed up, I need to plot memory and number of participants (in this case there’s is 28). This is the data that I have subsetted, I need to plot a histogram for the “memory” variable of two groups of participants: “treat” (short for treatment) then “placebo” which i will recode to include

structure(list(time = c(213.4418689, 168.6752202, 268.2073257, 
289.8671837, 272.5496501, 203.4556788), age = c("21-35", "21-35", 
"21-35", "21-35", "21-35", "21-35"), group = c("treat", "treat", 
"treat", "treat", "treat", "treat"), memory = c(7.196530159, 
7.07164458, 7.572323115, 7.42767848, 7.736018388, 6.920243195
)), row.names = c(NA, -6L), class = c("spec_tbl_df", "tbl_df", 
"tbl", "data.frame"), spec = structure(list(cols = list(time = structure(list(), class = c("collector_double", 
"collector")), age = structure(list(), class = c("collector_character", 
"collector")), group = structure(list(), class = c("collector_character", 
"collector")), memory = structure(list(), class = c("collector_double", 
"collector"))), default = structure(list(), class = c("collector_guess", 
"collector")), skip = 1L), class = "col_spec"))
1 Like

I used the data you posted to make a data set with both "treat" and "placebo" values. Don't worry if how I did that is not clear.

I then show two ways to make a histogram of the two subsets. The data set is so small that the histogram is ugly but I hope it is enough to show you the method.

#invent data
library(dplyr, warn.conflicts = FALSE)
DF <- structure(list(time = c(213.4418689, 168.6752202, 268.2073257, 
                               289.8671837, 272.5496501, 203.4556788), 
                      age = c("21-35", "21-35","21-35", "21-35", "21-35", "21-35"), 
                      group = c("treat", "treat", "treat", "treat", "treat", "treat"), 
                      memory = c(7.196530159, 7.07164458, 7.572323115, 7.42767848, 7.736018388, 6.920243195)), 
                 row.names = c(NA, -6L), class = c("spec_tbl_df", "tbl_df","tbl", "data.frame"), 
                 spec = structure(list(cols = list(time = structure(list(), 
                                                                    class = c("collector_double", "collector")), 
                                                   age = structure(list(), class = c("collector_character", "collector")), 
                                                   group = structure(list(), class = c("collector_character", "collector")), 
                                                   memory = structure(list(), class = c("collector_double", "collector"))), 
                                       default = structure(list(), class = c("collector_guess","collector")), skip = 1L), 
                                  class = "col_spec"))

DF2 <- DF %>% mutate(group = "placebo", memory = memory * 0.9)
AllDat <- rbind(DF, DF2)

#histogram
library(ggplot2)
ggplot(AllDat, aes(x = memory, fill = group)) + 
  geom_histogram(binwidth = 0.5, color  = "white")


ggplot(AllDat, aes(x = memory, fill = group)) + 
  geom_histogram(binwidth = 0.5, color  = "white", position = "dodge")

Created on 2021-01-17 by the reprex package (v0.3.0)

1 Like

This topic was automatically closed 21 days after the last reply. New replies are no longer allowed.

If you have a query related to it or one of the replies, start a new topic and refer back with a link.